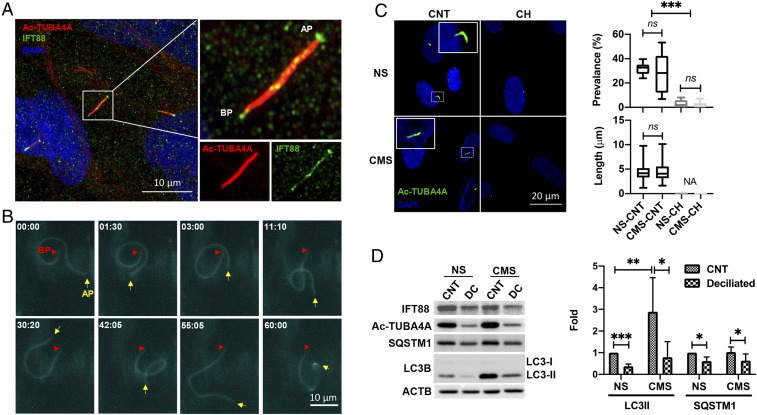
Fig. 1.
PC is a mechanosensor for CMS-induced autophagy. (A) Representative immunocytochemical analysis of PC in TM cells. Acetylated TUBA4A (red fluorescence) and IFT88 (green fluorescence) antibodies were used to identify the PC. DAPI was used to stain nuclei. Images were acquired with super resolution confocal microscope and processed by using Fiji software. BP and AP represent basal and apical process, respectively. (B) Time-lapse live-cell imaging of PC in TM cells transfected with p5HT6-mCherry. Images were acquired with CELENA X High Content Imaging System equipped with the Ibidi stage-top incubation system and processed by using Fiji software. BP and AP are indicated by red arrowheads and yellow arrows, respectively. Captured time (minute : second) is represented in the upper left of each picture. (C) Prevalence and length of PC in NS and CMS cells disrupted by CH. Cells were treated in 4 mM CH for 3 d and subjected to CMS after CH removal. (Left) Images taken after 24 h in NS and CMS cells. Quantification analyses for the prevalence and length of PC were represented on the right. NS, nonstretch control; CMS, cyclic mechanical stretch; CH, chloral hydrate. Data are shown as the mean ± SD of three biological replicates (n = 10 for prevalence, n = 93 versus 55: NS versus CMS for length). NA, not applicable; ***P < 0.001; ns, not significant (ANOVA and Tukey’s post hoc test). (D) Protein levels of LC3-II and SQSTM1 in TM cells subjected to CMS (8% elongation, 24 h) with or without PC disruption, evaluated by WB. Band intensities were quantified by Image Lab touch software and normalized with β-actin (ACTB). Data are shown as the mean ± SD (n = 5 for LC3 II and 3 for SQSTM1). *P < 0.05; **P < 0.01; ***P < 0.001 (Student’s t test).

