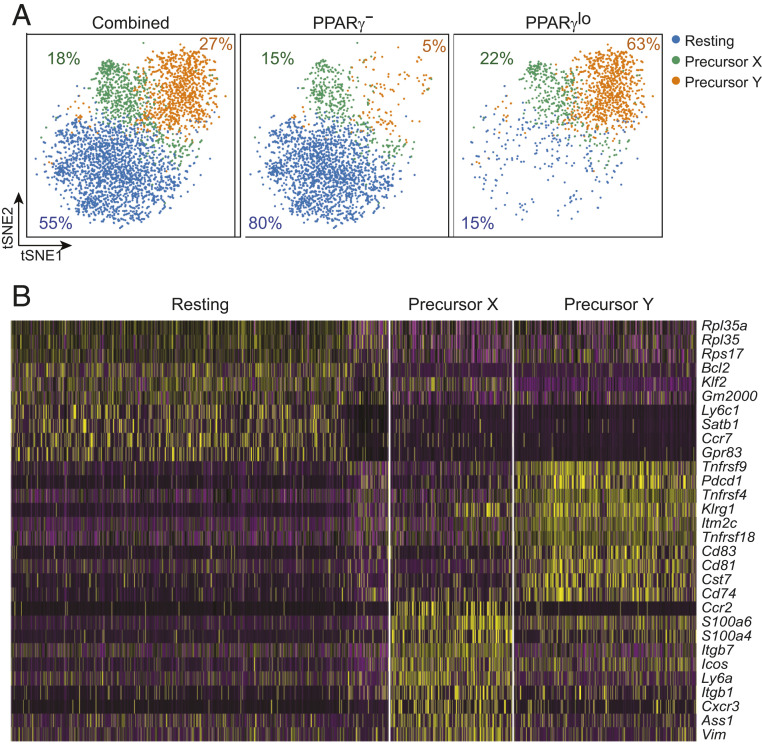
Fig. 1.
Heterogeneity of the splenic PPARγlo Treg population. scRNA-seq analysis of double-sorted PPARγ− and PPARγlo Tregs from the spleen of 6- to 8-wk-old Pparg-Tdt.Foxp3-Gfp mice. (A) tSNE plot of the combined (Left), PPARγ− Treg (Middle), and PPARγlo Treg (Right) single-cell datasets. Numbers indicate the frequency of each population. (B) Heatmap of the 10 most differentially expressed transcripts among the three clusters.

