Fig. 2.
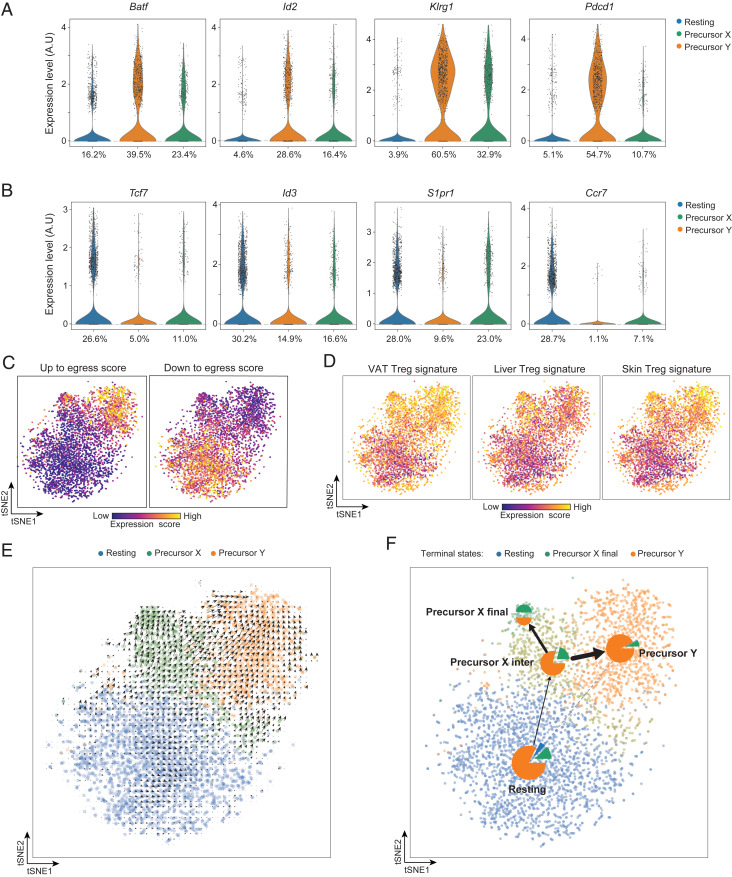
Transcriptionally assessed precursor potential of the splenic PPARγlo Treg subpopulations. (A) Violin plots of transcripts characteristically up-regulated as tissue-Treg precursors exit the spleen. Numbers refer to the percentage of cells in the designated cluster that express a given transcript. A.U., arbitrary units. (B) Violin plots of transcripts encoding proteins that need to be down-regulated for tissue-Treg precursors to exit the spleen. Numbers refer to the percentage of cells in the designated cluster expressing a given transcript. (C) Heatmaps depicting up to egress (Left) and down to egress (Right) scores, determined per SI Appendix, Materials and Methods. Intensity scales (Bottom). (D) Heatmap depicting expression of VAT (Left), liver (Middle), and skin (Right) Treg-specific transcripts, as per Dataset S1. Intensity scales (Bottom). (E) RNA-velocity analysis of the splenic PPARγlo and PPARγ− scRNA-seq datasets. (F) Trajectory inference analysis of the splenic PPARγlo and PPARγ− scRNA-seq datasets represented as a partition-based graph abstraction plot. Pie charts indicate the terminal cell fates averaged in each cluster. The edges show the direction of the inferred trajectory, and the thickness represents the transcriptional similarity between clusters.

