Fig. 4.
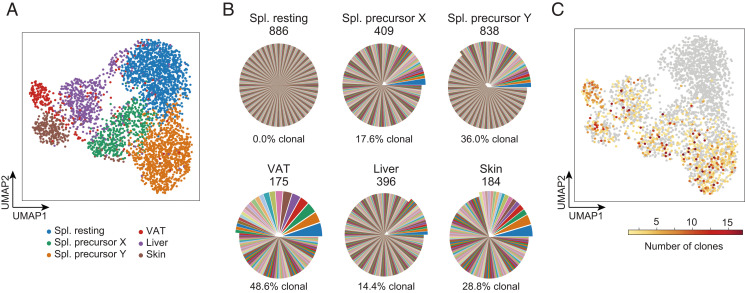
scTcr-seq analysis of splenic Treg splits and tissue-Treg populations. (A) UMAP of scRNA-seq data from the PPARγ− and PPARγlo splenic Treg populations and from the indicated tissue-Treg populations from a 20-wk-old Pparg-Tdt.Foxp3-Gfp male. (B) Pie charts were generated from corresponding scTcr-seq data. For each cell cluster, clones of cells sharing the exact same nucleotide sequence in the CDR3-encoding regions of the Tcra and Tcrb genes are shown as differently colored pie slices, the width of the slice reflecting the number of cells in that clone. Shared colors across cell clusters do not indicate shared clones in this representation. Values above show the total number of cells within that cluster with identified TCR-α and -β chains. Percentages and offset portions of the pies show the frequencies of clonally expanded cells, that is, cells that had a TCR sequence shared by two or more cells. (C) Linking scRNA-seq and scTcr-seq. UMAP space as in A. Cells are colored according to their clone size; color key (Bottom). Spl., spleen.

