Fig. 5.
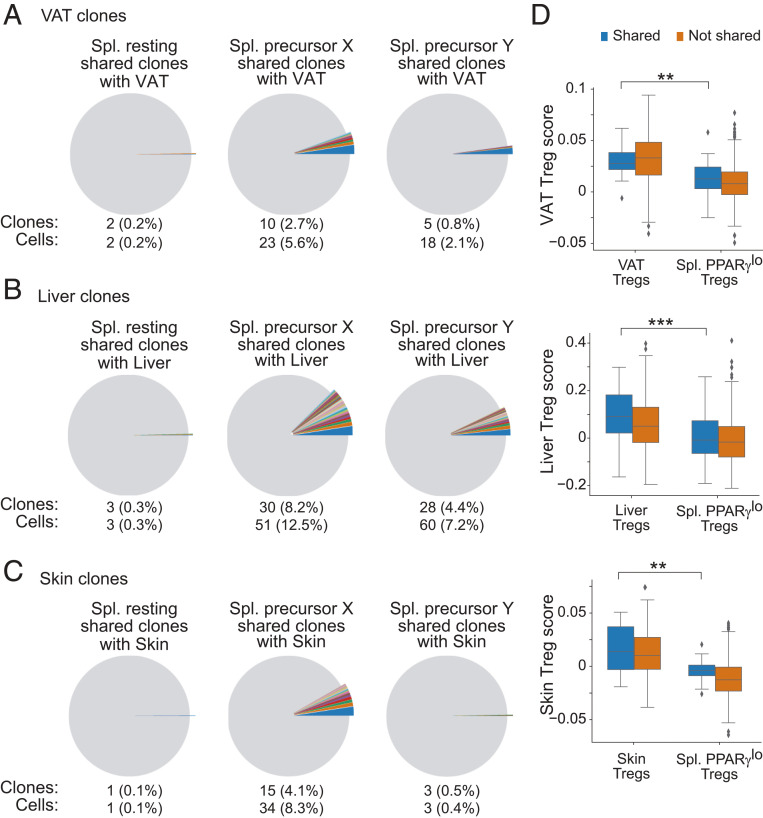
Sharing of TCR sequences between tissue-Tregs and PPARγlo putative precursors in the spleen. (A–C) Pie charts depicting cell clones shared between the various tissue-Treg populations and the splenic clusters. Offset pie slices and text below the pies indicate the number and frequency of splenic Tregs in the resting (Left), precursor X (Middle), and precursor Y (Right) clusters that share CDR3-encoding Tcra and Tcrb sequences with the VAT (A), liver (B), and skin (C) Treg populations. Shared clones are shown in individual colors; nonshared clones are colored in gray. Colors shared across the splenic subpopulations do not connote shared sequences. (D) Tissue-Treg signature scores for splenic PPARγlo Tregs and VAT (Top), liver (Middle), and skin (Bottom) Tregs. Plotted for cells with sharing (blue) or nonsharing (orange) CDR3-encoding Tcra and Tcrb nucleotide sequences between splenic PPARγlo Tregs and the indicated tissue-Tregs. Box plots indicate the interquartile range (IQR), and the line indicates the median. Whiskers indicate the range, and outliers outside this range (>1.5*IQR) are plotted. Wilcoxon rank-sum test; **P ≤ 0.01, ***P ≤ 0.001.

