TABLE 2:
Solid state nanopore materials
| Solid state | Material | Thickness range (nm) |
Pore diameter (nm) |
Ideal biomarker/ polymer class |
|---|---|---|---|---|
| (See reference (9) for image) | Silicon | 18.0–75.0 | > 5.0 | dsDNA, dsRNA, protein, peptide, antibody capture, synthetic polyelectrolyte |
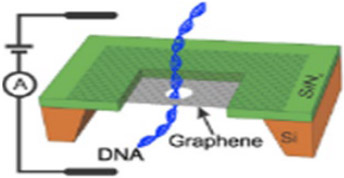 |
Gaphene | 1.0–5.0 | > 2.0 | dsDNA, ssDNA, dsRNA, ssRNA, protein, peptide, antibody capture, synthetic polyelectrolyte |
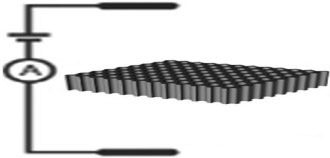 |
Aluminum | 5 × 10⁴ to 10 × 104 | > 10.0 | dsDNA, dsRNA, protein, peptide, antibody capture |
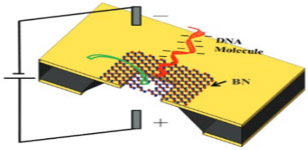 |
Boron nitride | 1.0–1.3 | > 12.3 | dsDNA, dsRNA, protein, peptide, antibody capture |
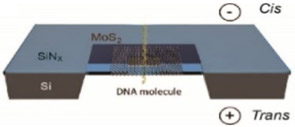 |
Molybdeneum disulfide | 6.5 | > 5.0 | dsDNA, ssDNA, dsRNA, ssRNA, protein, peptide, antibody capture, synthetic polyelectrolyte |
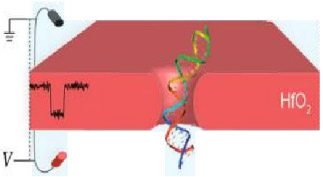 |
Hafnium oxide | 2.0–7.0 | > 1.4 | dsDNA, ssDNA, dsRNA, ssRNA, protein, peptide, antibody capture, synthetic polyelectrolyte |
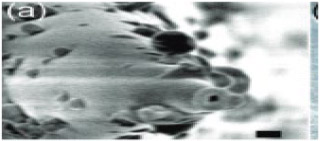 |
Glass (Borosilicate) | 20.0–75.0 | > 14.0 | dsDNA, dsRNA, protein, peptide, antibody capture |
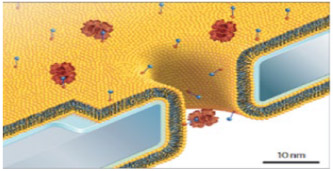 |
Lipid coated | Depends on membrane material | Depends on membrane material | Depends on membrane material |
