Fig. 2.
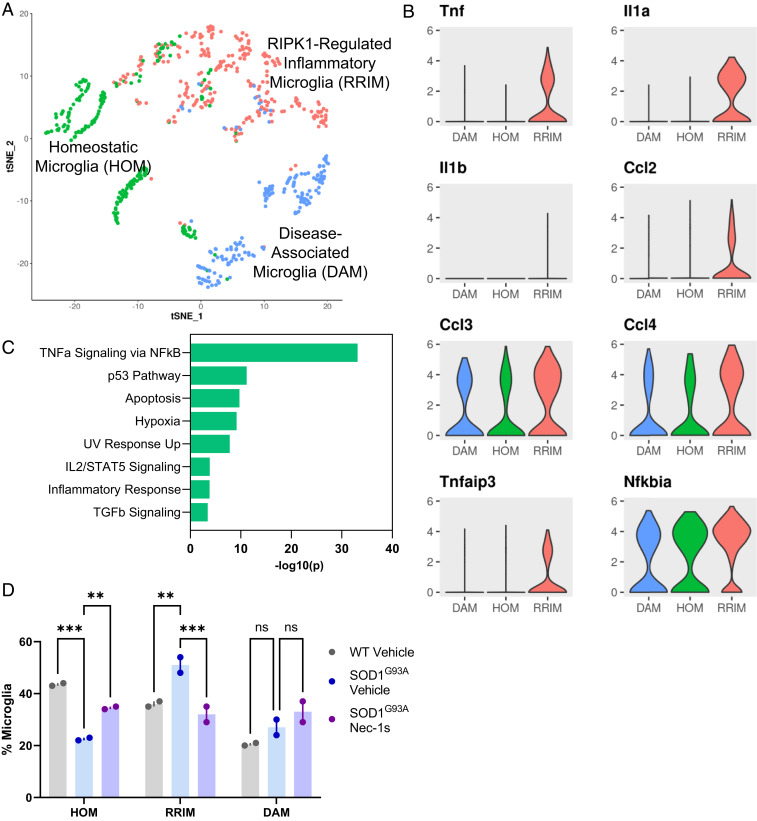
RIPK1-regulated inflammatory microglia are up-regulated in SOD1G93A mice. (A) tSNE plot of microglia from all groups reclustered in Seurat using semisupervised clustering to identify three subpopulations, including previously identified DAM and HOM. n = 6 animals. (B) Violin plots of marker genes for the RRIM subcluster from all groups generated using Seurat. Values plotted are transcripts per million (TPM). n = 6 animals. (C) GO analysis of pathways enriched in marker genes (padj < 0.01, logFC >1.5) for RRIM subcluster analyzed using GSEA. (D) Proportion of RRIM cluster as a percentage of total microglia was calculated for each animal and quantified using two-way ANOVA with multiple comparison testing relative to SOD1G93A Vehicle group. n = 2 animals per group. **P < 0.01; ***P < 0.001; ns, not significant. Data are represented as mean ± SEM.

