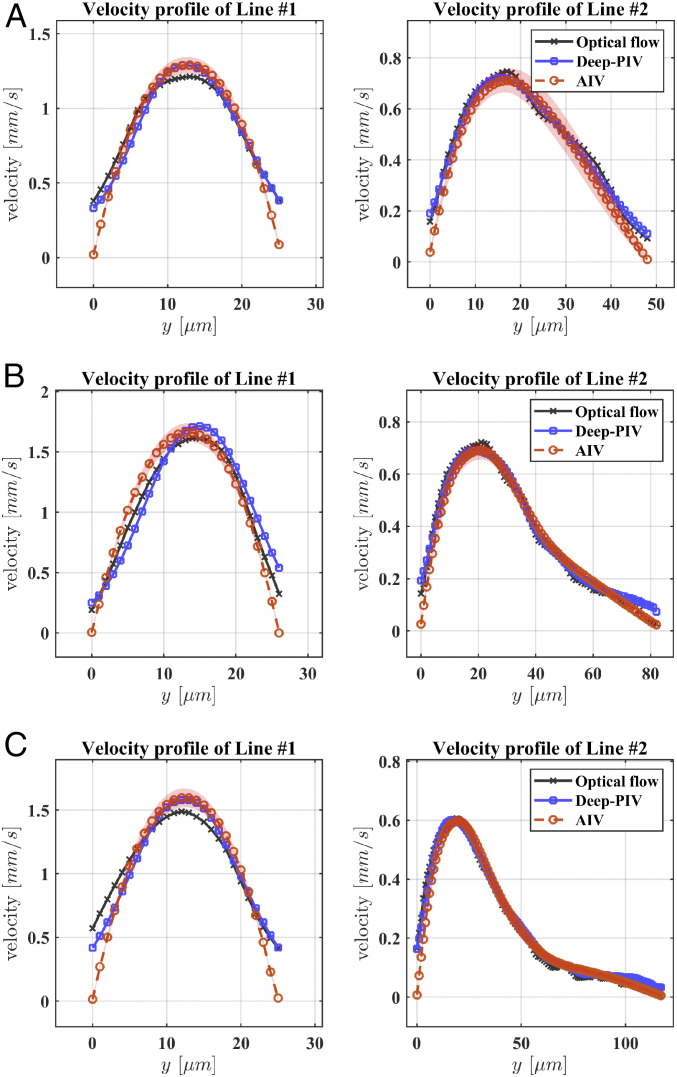
Fig. 4.
Comparison of the velocity profiles predicted by AIV, conventional optical flow, and Deep-PIV along two cross-lines in MAOAC channels with BNR = 2 (A), BNR = 3.6 (B), BNR = 5 (C). Comparisons are performed along two dotted lines marked at Fig. 3, Left. Line #1 is selected at the outlet portion of the microchannel, whereas Line #2 crosses the deepest region of the MAs. The symbols representing AIV predictions signify time-averaged values from 100 image frames, and the shadows represent SDs.

