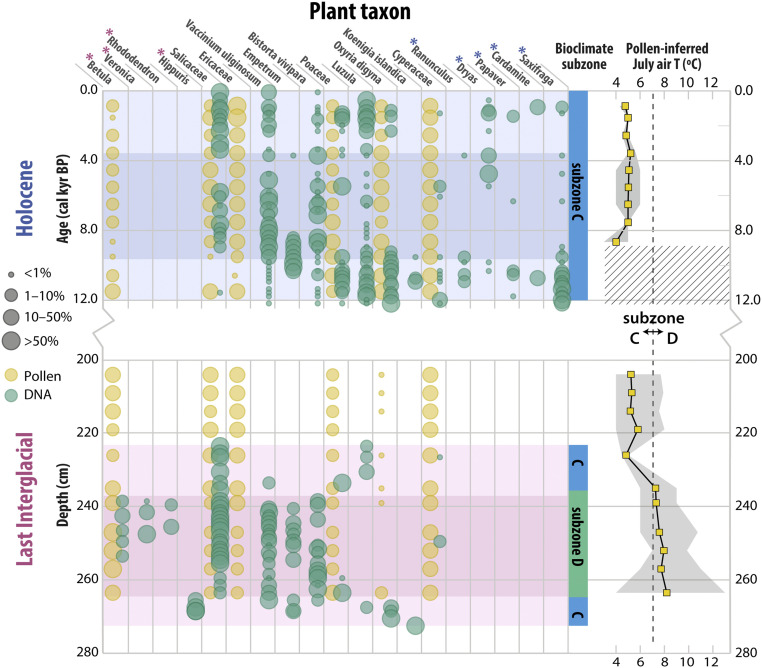
Fig. 3.
Vegetation and climate history at Lake CF8. Results from DNA metabarcoding (green circles; taxa occurring as >1% of reads in ≥2 samples included) and pollen (yellow circles; taxa averaging >5% included) are shown as circles scaled to relative abundance of sample reads or pollen grains (grouped into four percentage bins shown in legend). Note that in the LIG, no DNA analyses were completed above 223.5 cm, and no pollen analyses were completed below 263.5 cm. The pink and blue shading delineates biostratigraphic units (lower, middle, and upper for each interglacial) inferred from constrained hierarchical clustering of sedaDNA metabarcoding results. The pink and blue asterisks indicate taxa only occurring in the LIG and the Holocene, respectively, based on sedaDNA. Bioclimate subzone assignment (colors correspond to Fig. 1) is based on sedaDNA-inferred taxa presence within each unit. Pollen-inferred July air temperature estimate is based on the modern analog technique and includes the temperature range (gray band) from the five best modern analogs (see Materials and Methods). The dashed line indicates mean July temperature threshold (7 °C) defining the boundary between subzones C and D. The hatched area denotes interval with no adequate modern analog. Note the break in the y-axis and that Holocene samples are plotted on age scale while LIG samples are plotted on depth scale.

