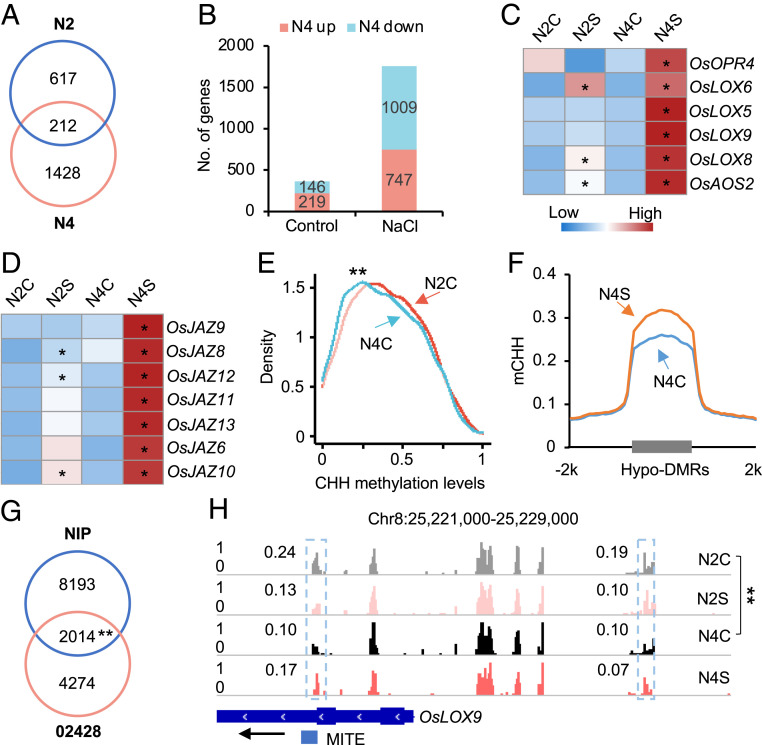
Fig. 5.
Ploidy-induced CHH hypomethylation primes JA-related genes for stronger activation in Nipponbare tetraploid rice. (A) Venn diagram showing overlap of salt responsive genes between diploid (N2) and tetraploid (N4) rice. (B) Number of up- or down-regulated genes between diploid (N2) and tetraploid (N4) without (control) or with salt (NaCl) stress. (C and D) Expression levels of JA biosynthesis (C) and signaling (D)-related genes in diploid and tetraploid rice without (N2C versus N4C) or with salt (N2S versus N4S) treatment. Asterisks indicate expression level difference before and after salt treatment in diploid and tetraploid rice, respectively (P < 0.05 and log2[fold change] ≥ 1). (E) CHH methylation levels of ploidy-induced CHH hypo-DMRs (02428) in Nipponbare diploid (N2C) and tetraploid rice (N4C). Double asterisks indicate a statistical significance level of P < 7e−7 (Wilcoxon rank sum test). (F) CHH methylation changes in hypo-DMRs between N4C and N2C in tetraploid rice after salt stress (N4S versus N4C). (G) Venn diagram showing the overlap of ploidy-induced hypo-DMR genes between Nipponbare and 02428. Double asterisks indicate a statistical significance level of P < 3e−175 (Hypergeometric test). (H) A genome browser snapshot showing CHH methylation changes of OsLOX9. The gene and TE are shown with a black arrow indicating transcriptional direction. Numbers in snapshot indicate CHH methylation levels of regions in dotted box. Double asterisks indicate the difference between N4C and N2C at a statistical significance level of P < 0.01 (Fisher’s exact tests).

