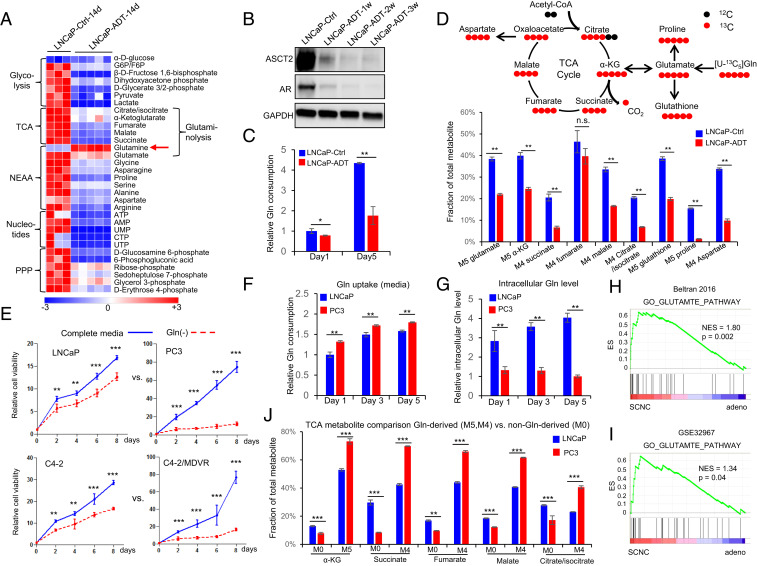
Fig. 1.
Androgen deprivation inhibits glutamine catabolism, and therapy-resistant PCa cells are more addicted to glutamine. (A) Heat map shows that ADT decreases levels of metabolites involved in important metabolism pathways (n = 3 and 5 replicates for the control and ADT groups, respectively). (B) Western blot shows that glutamine transporter ASCT2, similar to AR, is decreased after ADT. (C) UPLC-MS analysis of cell culture medium to compare glutamine consumption with or without ADT (n = 3 cultures per group). (D) Tracing of 13C-labeled glutamine influx and mass isotopomer analysis of [U–13C5] glutamine-derived metabolites in LNCaP cells with or without ADT. α-KG, α-ketoglutarate (n = 3 cultures per group). (E) Relative cell viability of LNCaP, PC3, C4-2, and C4-2MDVR cells cultured with or without glutamine (n = 3 replicates for two independent experiments). (F and G) Ultra performance liquid chromatography-mass spectrometry (UPLC-MS) analysis of glutamine uptake and intracellular glutamine levels in LNCaP and PC3 cells. Metabolites were extracted from culture medium and cell pellets at the indicated time points (n = 3 cultures per group). (H and I) GSEA of “GO_GLUTAMATE_PATHWAY” gene sets to compare SCNC and adenocarcinoma in Beltran 2016 (12) and GSE32967. ES, enrichment score; NES, normalized enrichment score. (J) Mass isotopomer analysis of TCA cycle metabolite abundance in LNCaP and PC3 cells (n = 3 cultures per group). M0 represents the non-Gln–derived (mainly glucose-derived) metabolite pool, whereas M5 and M4 represent the 13C-labled Gln-derived metabolite pool. Data are expressed as mean ± SD. *P < 0.05, **P < 0.01, and ***P < 0.001 by two-tailed Student’s t test. n.s., not significant.

