Fig. 3.
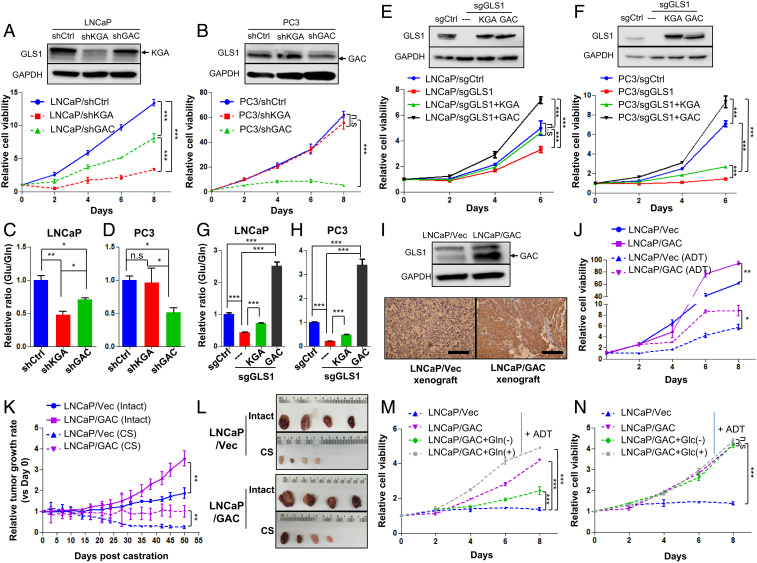
The GLS1 isoform switch confers castration resistance to PCa cells. (A and B) Western blots show KGA and GAC expression of LNCaP and PC3 cells transduced with KGA-specific, GAC-specific, or control shRNAs and the corresponding cell viability for each cell line (n = 3 replicates for two independent experiments). (C and D) Glutamine utilization indicated by the ratio of intracellular glutamate/glutamine of cells in A and B (n = 3 cultures per group). (E and F) Cell viability after knocking out GLS1 and introducing KGA and GAC back, respectively (n = 3 replicates for two independent experiments). (G and H) Enzymatic activity of KGA and GAC as measured by the ratio of intracellular glutamate/glutamine in cells described in E and F (n = 3 cultures per group). (I) Western blot and IHC staining of GAC overexpression in LNCaP cells and the corresponding xenograft tumor. (J) Cell viability of LNCaP cells overexpressing GAC and LNCaP/Vec control in regular medium or charcoal-stripped medium (ADT) (n = 3 replicates for two independent experiments). (K and L) Xenograft tumor growth curves with or without surgical castration (CS) and representative images of tumor size (n = 4 in each group). (M and N) Cell viability of LNCaP/Vec and LNCaP/GAC treated with glutamine (Gln)/glucose (Glc) depletion or supplemented glutamine/glucose in the charcoal-stripped medium (ADT) (n = 3 replicates for two independent experiments). Data are expressed as mean ± SD. *P < 0.05, **P < 0.01, and ***P < 0.001 by two-tailed Student’s t test. n.s., not significant.

