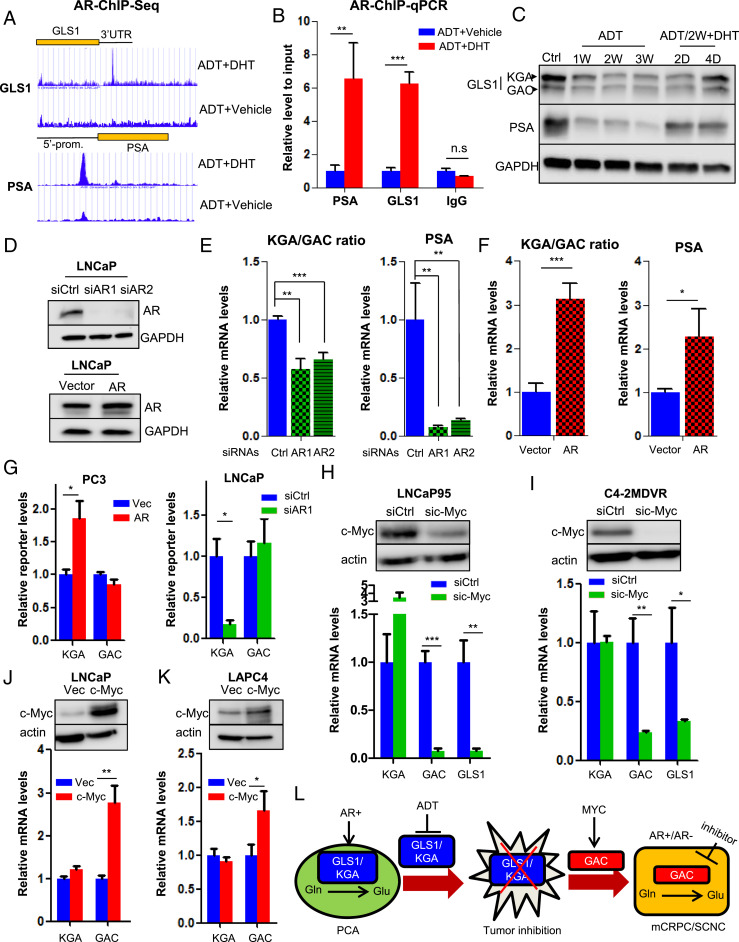
Fig. 5.
AR and MYC cooperatively regulate GLS1 isoform switch. (A) Identification of AR-binding sites in GLS1–3′UTR by ChIP sequencing. Prostate-Specific Antigen (PSA) is used as a positive control. (B) ChIP–qPCR showing AR binding to GLS1–3′UTR upon DHT stimulation. (C) Western blot showing KGA and GAC expression in LNCaP cells treated with ADT and followed by 10 nM DHT at the indicated time points. (D) Western blot showing AR expression in LNCaP cells transduced with siRNAs or complementary DNA (cDNA) plasmid expressing AR. (E and F) Transcript ratio of KGA/GAC in LNCaP cells after knockdown or overexpression of AR. (G) GLS1 minigene reporter was cotransfected with either AR cDNA plasmid in PC3 cells or AR-targeting siRNA in LNCaP cells. Transcript levels of isoforms were detected by qPCR by using KGA- and GAC-specific primer pairs. (H and I) Western blot showing knockdown of c-Myc by specific siRNA pool in LNCaP95 and C4-2MDVR cells (Top) and transcript levels of KGA, GAC, and GLS1 after c-Myc reduction (Bottom). (J and K) Western blot showing ectopic expression of c-Myc in LNCaP and LAPC4 cells (Top) and transcript levels of KGA, GAC, and GLS1 after c-Myc overexpression (Bottom). (L) A model depicting how GLS1 isoform switch drives castration resistance and disease progression in PCa. PCA, prostate adenocarcinoma; Glu, glutamate; Gln, glutamine; mCRPC, metastatic castration-resistant PCa; SCNC, small-cell neuroendocrine PCa. For each assay, n = 3 replicates were performed. Data are expressed as mean ± SD. *P < 0.05, **P < 0.01, and ***P < 0.001 by two-tailed Student’s t test. n.s., not significant.

