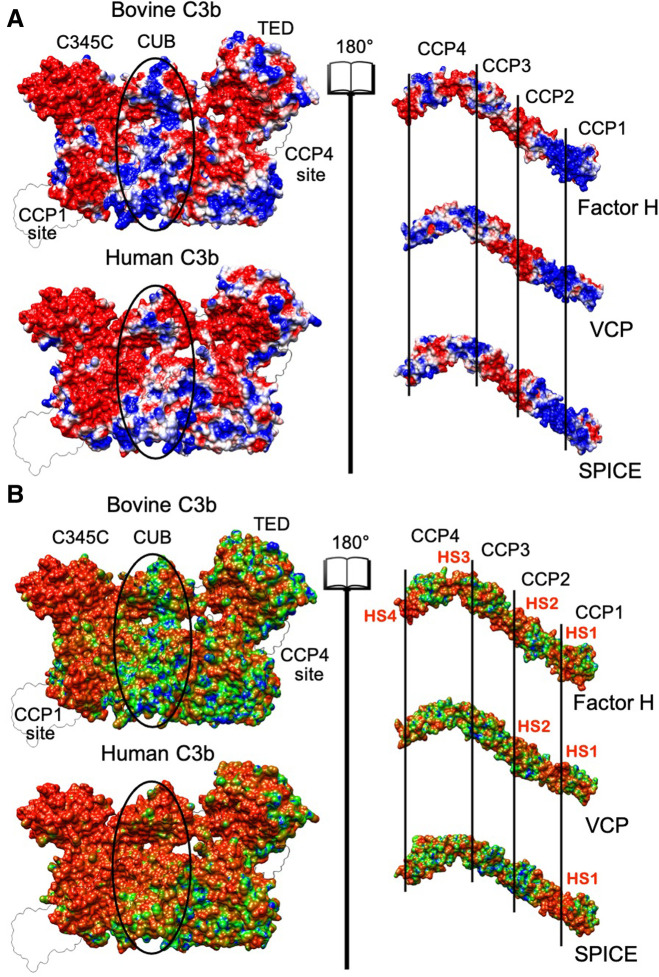
FIGURE 2.
(A) Electrostatic potential surface projection for the bovine and human C3b proteins (left panel) and for the Factor H, VCP and SPICE ligands (right panel). The left and right panels are separated by an “open book” view, which reveals the surfaces of contact at the interface of the protein-ligand complex. The protein domains of C3b (C345C, CUB, and TED) and the complement control protein (CCP) modules of Factor H, VCP and SPICE (CCP1-4) are also shown. On the 3D structure of C3b, the location of the CCP1 and CCP4 binding sites is also shown. The ellipses depict differences in the central regions of bovine and human C3b. The electrostatic potential is colored from red (negative) to blue (positive). (B) Electrostatic Similarity Index (ESI), projected on the 3D structure of the bovine and human C3b protein (left panel) and of the Factor H, VCP and SPICE ligands (right panel). Observed electrostatic hotspots on the ligands are marked as HS1–HS4. The color scheme blue–green–orange represents low–to–high similarity, corresponding to ESI values of 0.6–0.8–1.0 for the bovine and human C3b, and ESI values of 0.4–0.7–1.0 for the ligands.

