Figure 10.

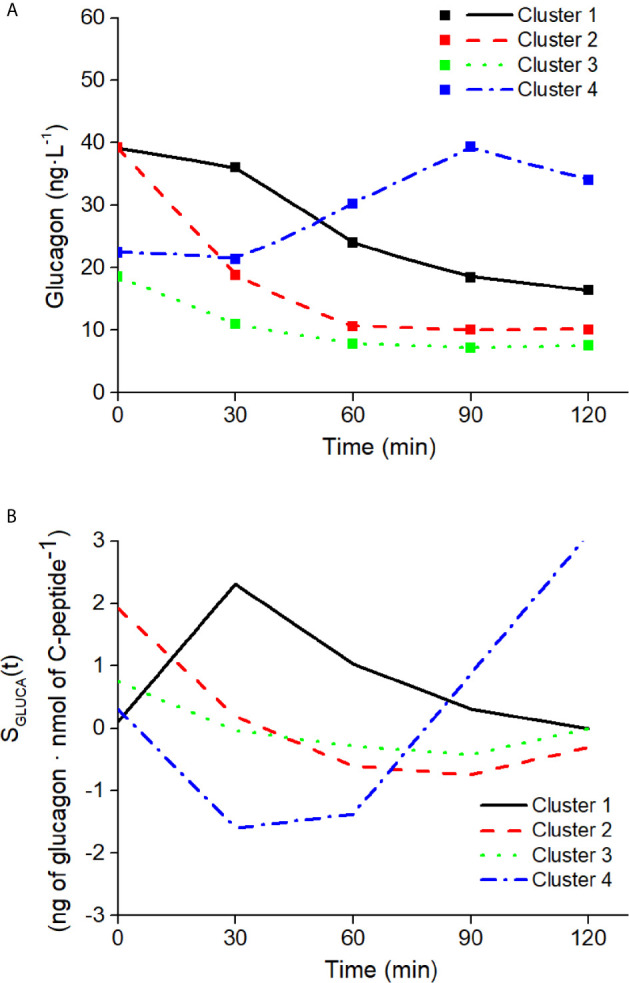
Best-fit results (A) and SGLUCA(t) estimates (B) on the four clusters of patterns in glucagon kinetics. Squares in panel (A) are the reference experimental values; lines are the model predictions.

Best-fit results (A) and SGLUCA(t) estimates (B) on the four clusters of patterns in glucagon kinetics. Squares in panel (A) are the reference experimental values; lines are the model predictions.