
Figure 9.
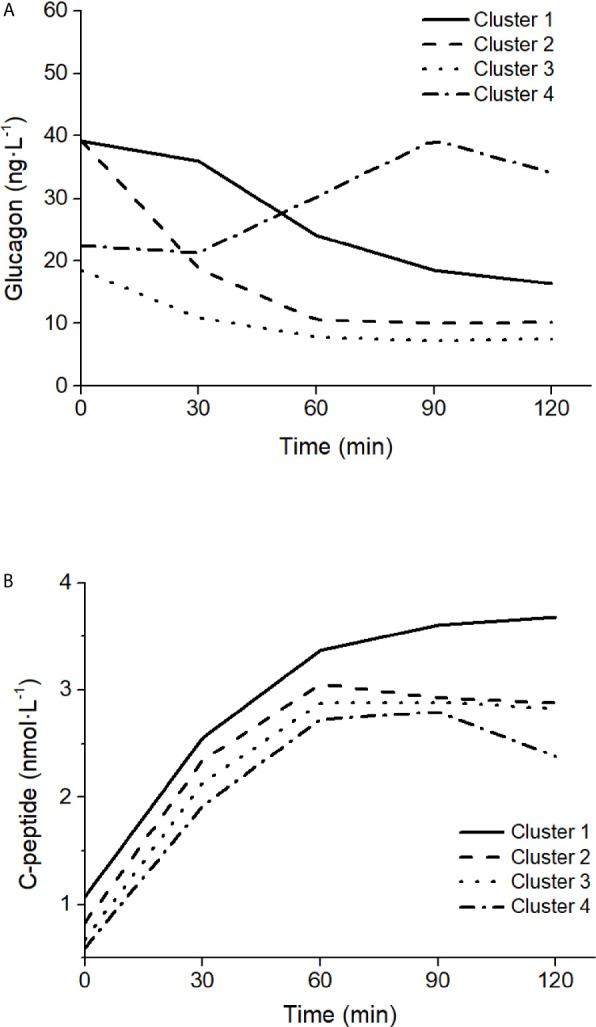
Glucagon (A) and C-peptide (B) curves in the four clusters of patterns in glucagon kinetics, modified from Gar et al. (38).
Official websites use .gov
A
.gov website belongs to an official
government organization in the United States.
Secure .gov websites use HTTPS
A lock (
) or https:// means you've safely
connected to the .gov website. Share sensitive
information only on official, secure websites.
Glucagon (A) and C-peptide (B) curves in the four clusters of patterns in glucagon kinetics, modified from Gar et al. (38).