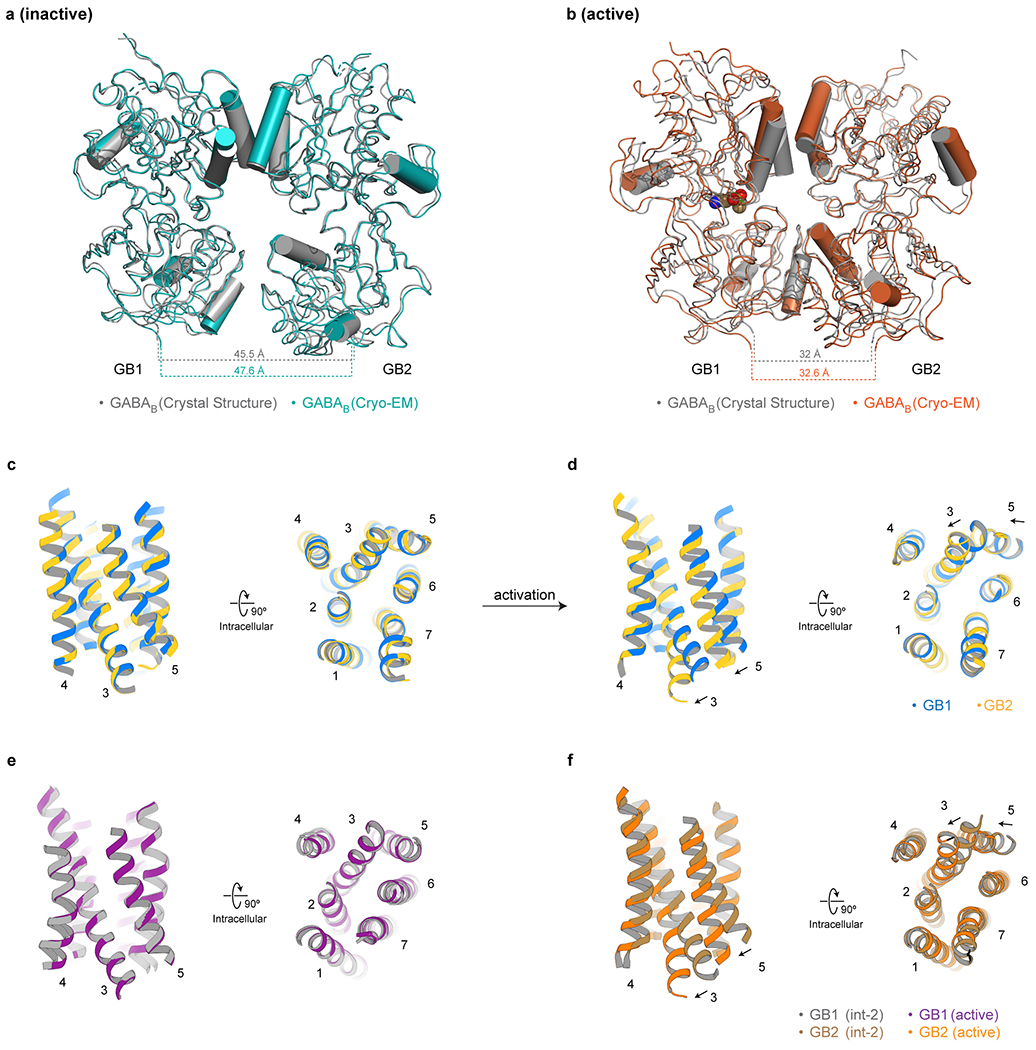
Extended Data Fig. 7 |. Comparisons with previous crystal structures and additional details of activation-related transitions in GABAB.

a, Comparison of the VFT domains between the apo cryo-EM structure (teal) and the apo crystal structure (PDB: 4MQE, grey). b, Comparison of the VFT domains between the active agonist/PAM-bound cryo-EM structure (orange) and the GABA-bound crystal structure (PDB: 4MS3, grey). c, Comparison between GB1 and GB2 TMDs in the inactive apo state demonstrates no substantial difference between the subunits. d, Comparison between GB1 and GB2 TMDs in the active agonist/PAM-bound state illustrates the differences between the subunits upon activation. e, GB1-TMD remains unchanged between the int-2 and the active agonist/PAM-bound states. f, Shifts of TM3 and TM5 at the intracellular side of the GB2-TMD between the int-2 and active states open up a cleft for the engagement of a G protein.
