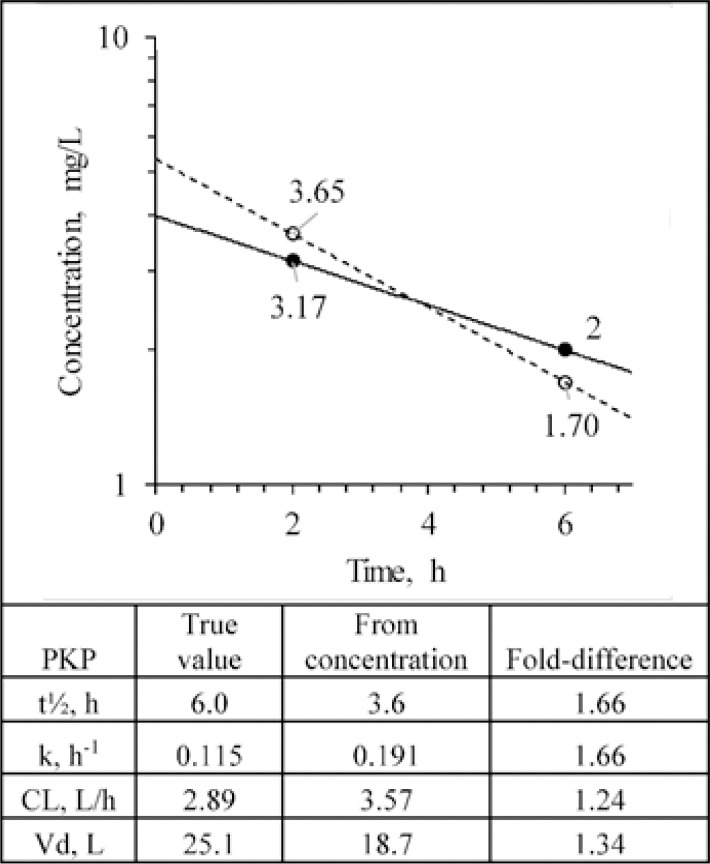
Fig. 1.

Pharmacokinetic estimation of a drug after intravenous bolus administration based on two drug concentrations in blood fluids. The true values and decline profile of a drug in a patient given 100 mg are shown as solid symbols and solid line. The open symbols and dashed line show what are measured from the assay. The table shows the true PKP values and those estimated from the measured plasma concentrations along with the fold-difference between the estimates. PKP, pharmacokinetic parameters; CL, clearance; Vd, volume of distribution.
