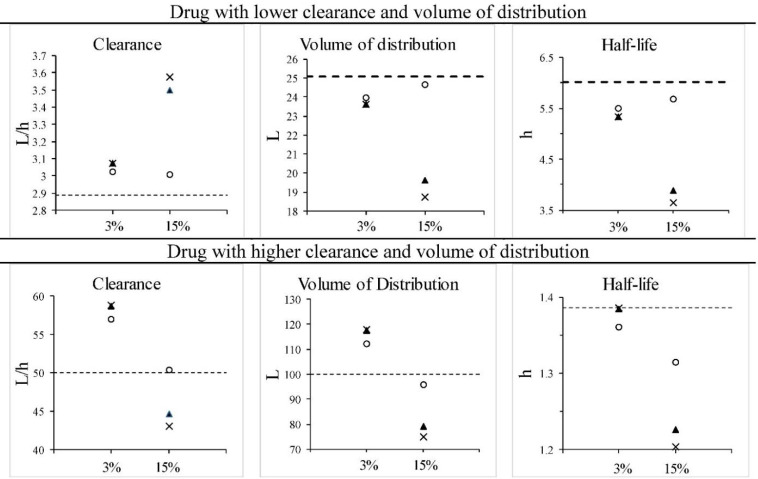
Fig. 2.
Two drugs following a one-compartment model given as an intravenous bolus, with PKP being low (upper panels) or high (lower panels) in value. Error in concentrations is introduced at the limits of the assay coefficient of variation (as depicted in Fig. 1). Dashed lines indicate the true values. The x-axis scale shows the CV% of the assay (3 or 15%). The symbols represent: ×, values from regression analysis (see Fig. 1); ○, Bayesian estimate with 10% CV in population PKP; ▲, Bayesian estimate with 50% CV% in population PKP. PKP, pharmacokinetic parameters; CV, coefficient of variation.

