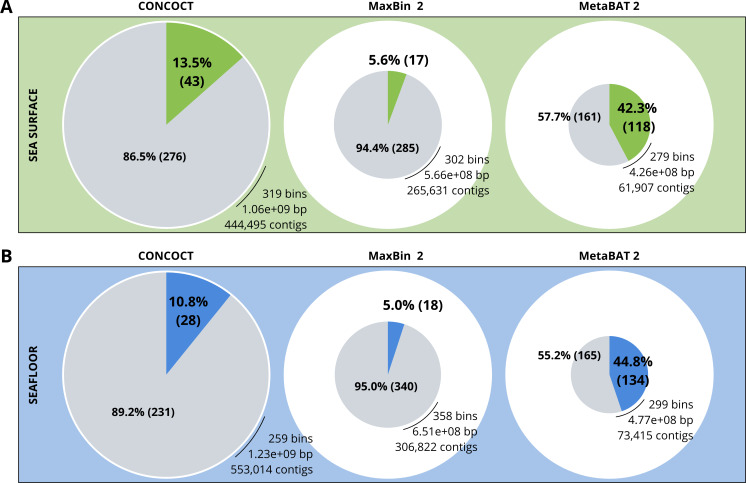
Figure 2. Binning comparison. Numbers of contigs binned and numbers of bad and good quality bins obtained with CONCOCT, MaxBin2 and MetaBAT 2 from the surface co-assembly (A) and the seafloor co-assembly (B).
Numbers of contigs binned is represented by the size of the pie plots. Numbers and percentages of bad quality bins and good quality bins are shown within the grey and coloured slices of the chart respectively. Good quality bins have an estimated completion above 50% and an estimated redundancy (also called estimated contamination) below 10% (Bowers et al., 2017).

