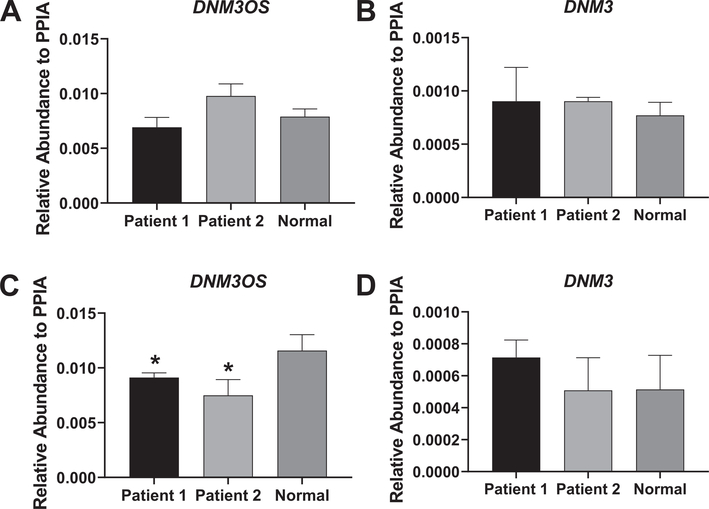
Fig. 6.
Expression of DNM3OS and DNM3 in patient and control fibroblasts. A, B. Relative expression of DNM3OS and DNM3 in the two patient sample fibroblasts and control, non-diseased fibroblasts at baseline. C, D. Relative expression of DNM3OS and DNM3 in patient and control fibroblasts following 3 days of osteogenic induction. Gene levels were expressed as relative abundance to PPIA. Experiments were carried out in triplicate and a Student’s t-test was used to determine statistical significance in mRNA expression between the control sample and each of the patient samples (*p < 0.05).

