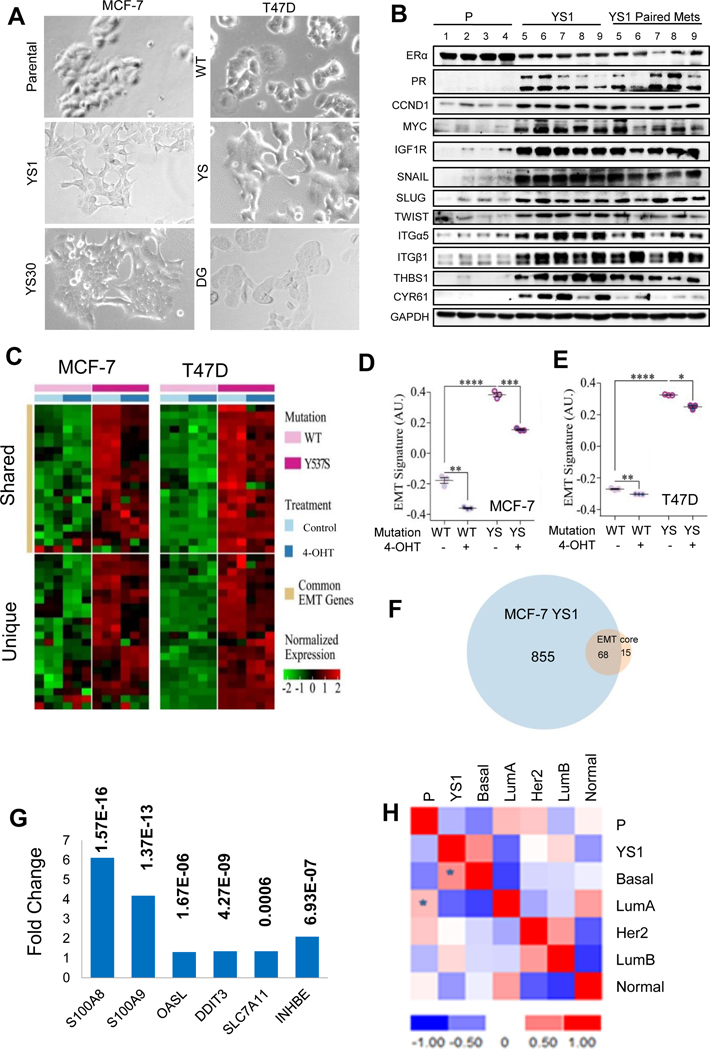
Fig. 2.
Y537S ESR1 mutants exhibit an EMT phenotype. A. Bright field images of ESR1 mutant MCF-7 and T47D cell lines growing in serum-containing medium. B. Immunoblot analysis of MCF-7 parental (n=4) and YS1 (n=5) primary /metastatic pairs growing after E2 withdrawal using indicated antibodies. C. Heat map representation of upregulated EMT genes expressed in common (upper panel) or unique (lower panel) in MCF-7 Y537S (YS1) and T47D Y537S cells compared to corresponding WT cells. D and E. EMT signature was shown from MCF-7 parental (WT) and YS1 (YS) or T47D Lenti WT and YS models. Cell were treated +/− 4-OHT for 24 hours in serum containing medium. The signature value is shown on the Y axis (AU arbitrary units): Data displayed as mean ± SD. Statistical significance calculated using Student t test, *, P <0.05 **, P <0.01 ***, P <0.001, ****, P <0.0001. F. Gene List Venn Diagram (http://genevenn.sourceforge.net/) was used to identify shared overexpressed genes in MCF-7 YS1 vs parental compared to the EMT core signature. G. Fold change average gene expression of six elevated genes in ER+/HER2- metastatic (n= 97) compared to primary (n= 276) breast cancers. P values are shown. Data analyses were performed in R version 3.5.1 and Bioconductor. Statistical significance was determined using the unpaired Student t-test. H, Gene expression of MCF-7 parental cells and MCF-7 YS1 cells grown in 5% CSS without E2 summarized in a correlation matrix were patterned with all five PAM50 centroids. Data calculated by Spearman’s Rank, with highest positive correlations denoted by *.

