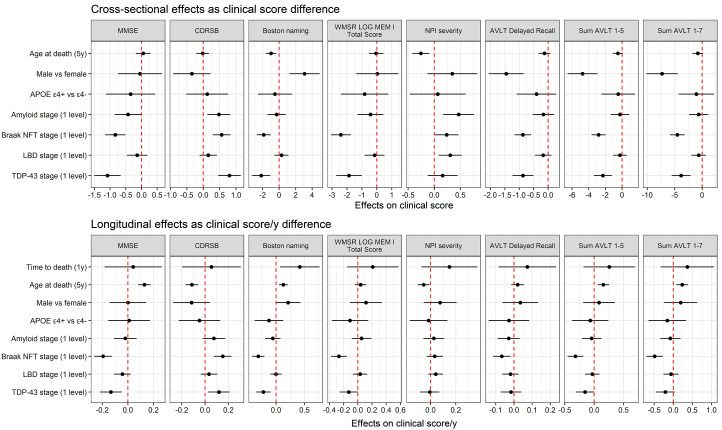
Fig. 1.
Forest plot showing estimates and 95% confidence intervals for cross-sectional and longitudinal models Forest plots that do not cross red dotted line represent statistically significant associations (p < 0.05). In our model, age at death was centered at 80 years old with 5 years per unit increase, and time to death was centered at 5 years before death with one year per unit increase.

