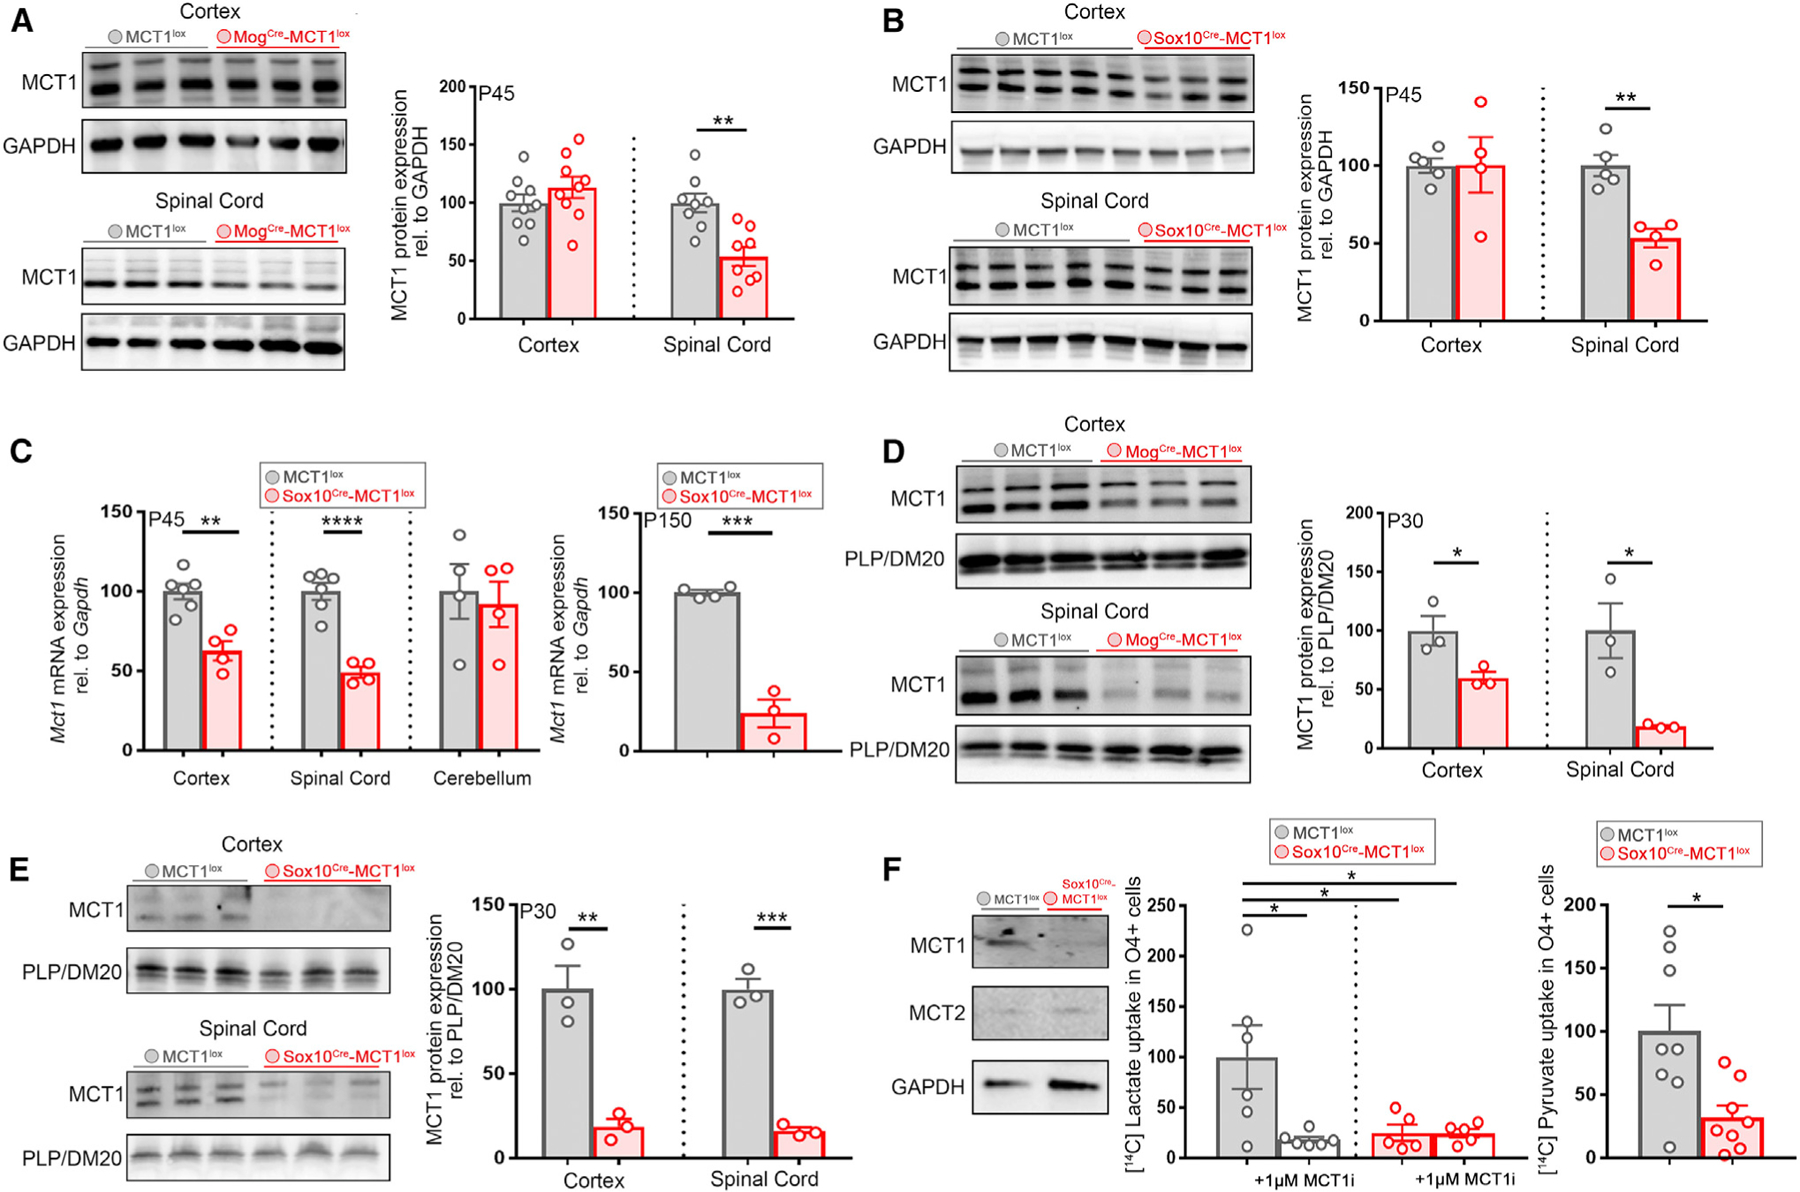
Figure 2. Loss of MCT1 Protein and Transporter Activity in the MogCre-MCT1lox and Sox10Cre-MCT1lox Conditional Null Mice.

(A) MCT1 expression in whole spinal cord tissue lysates from P45 MogCre-MCT1lox mice is reduced by 46% compared with MCT1lox controls, whereas the cortical MCT1 expression is unchanged (n = 8–9, **p < 0.01, Student’s t test). Data are represented as mean ± SEM.
(B) MCT1 protein expression in whole-tissue lysates from spinal cord derived from P45 Sox10Cre-MCT1lox and MCT1lox controls is reduced by 47% in the conditional nulls, whereas cortical MCT1 protein expression is unchanged (n = 4–5, **p < 0.01, Student’s t test). Data are represented as mean ± SEM.
(C) Left: Mct1 exon 2 mRNA expression analysis in P45 Sox10Cre-MCT1lox and MCT1 lox mice whole CNS tissue RNA extracts is reduced by 51% in spinal cord and 37% in the cortex (Ctx) of the conditional nulls, whereas cerebellar Mct1 mRNA expression is unchanged (n = 4–6, **p < 0.01 and ****p < 0.0001, Student’s t test). Right: Mct1 mRNA expression in cortical O4+ progenitors isolated from P150 MCT1lox and Sox10Cre-MCT1lox mice is reduced by 76% in the conditional nulls (n = 3–4, ***p < 0.001, Student’s t test). Data are represented as mean ± SEM.
(D) MCT1 protein in myelin fractions derived from Ctx and spinal cord of P30 MogCre-MCT1lox mice and MCT1lox mice is reduced by 40% in the Ctx and 81% in the spinal cord of the conditional nulls (n = 3, *p < 0.05, Student’s t test). Data are represented as mean ± SEM.
(E) Quantification of MCT1 protein expression in myelin fractions derived from spinal cord and Ctx from P30 Sox10Cre-MCT1lox and MCT1 lox mice reveals an 84% reduction in the spinal cord and an 81% reduction in the Ctx of the conditional null mice (n = 3, ***p < 0.001, **p < 0.01, Student’s t test). Data are represented as mean ± SEM.
(F) MCT protein expression in OL lineage cultures derived from Sox10Cre-MCT1lox and MCT1lox P3 pups. MCT1 expression is absent from O4+ progenitor cell cultures derived from Sox10Cre-MCT1lox pups and is not compensated by changes in MCT2 expression. Quantification of [14C]lactate uptake in OL lineage cultures reveals a 75% reduction in the Sox10Cre-MCT1lox-derived cultures compared with the MCT1lox-cultured cells. Treatment with 1 µM MCT1 inhibitor AR-C155858 (MCT1i) affects [14C]lactate uptake in MCT1lox cultures by 82% (n = 5–6, *p < 0.05, one-way ANOVA with Tukey’s multiple comparison test). Quantification of [14C]pyruvate uptake between Sox10Cre-MCT1lox and MCT1lox OL lineage cultures reveals a 68% reduction in [14C]pyruvate uptake in the conditional nulls (n = 8, *p < 0.05, Student’s t test). Data are represented as mean ± SEM.
