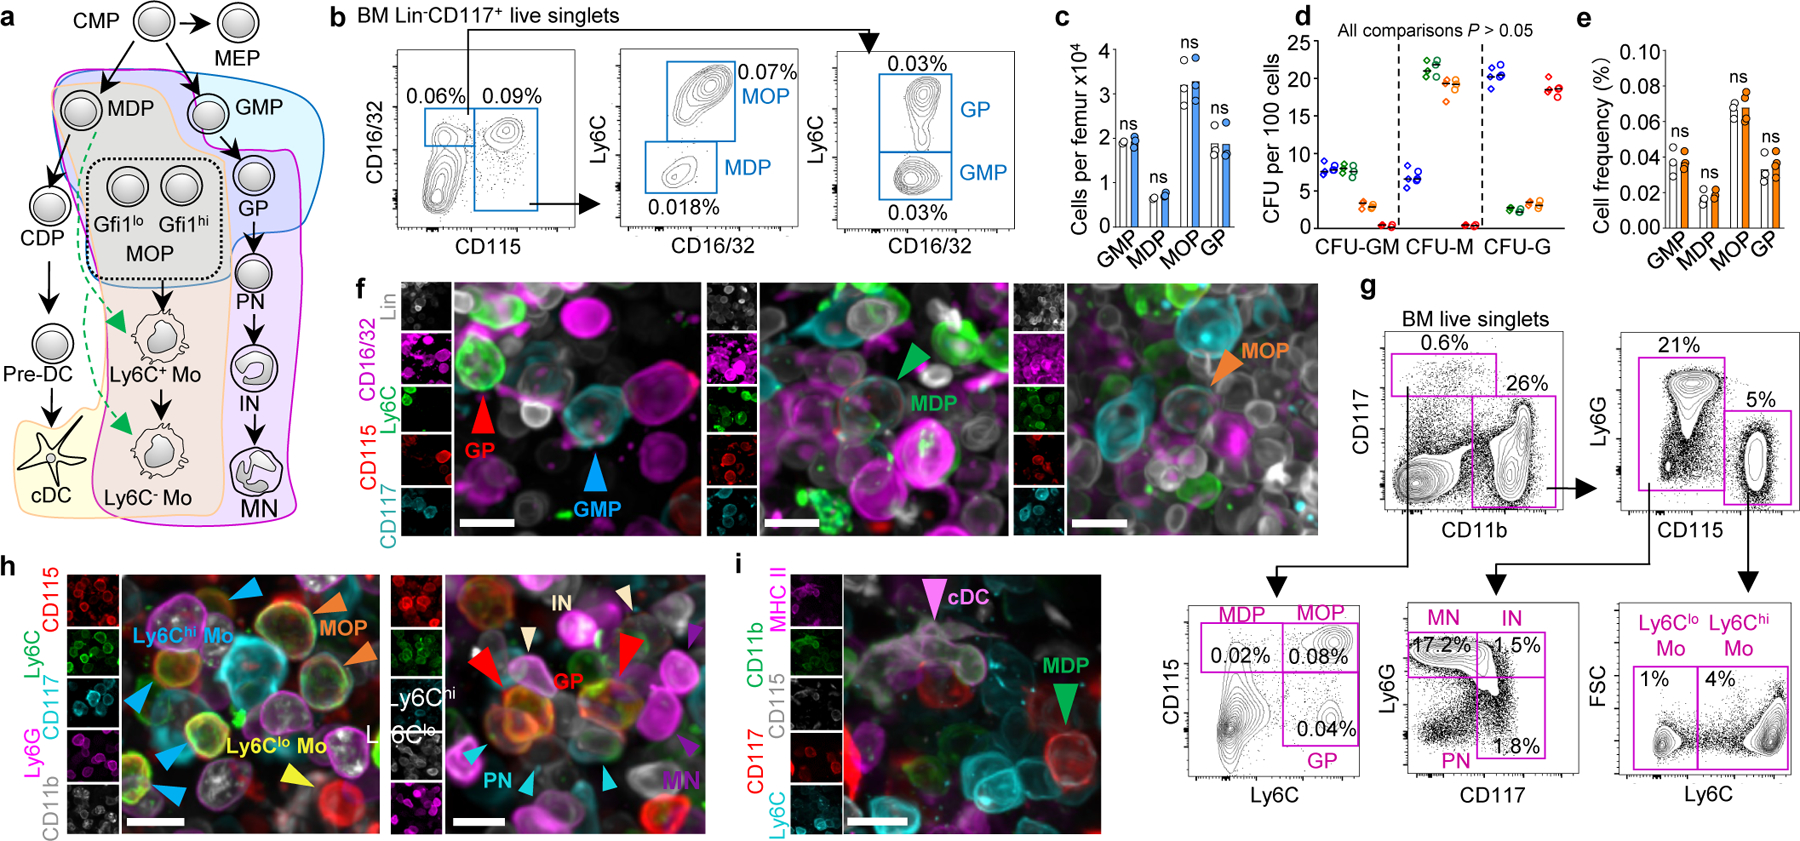
Figure 1. Stain development.

a, Schematic representation of myelopoiesis. b, FACS gates for isolation and imaging of the indicated progenitors. c, d, Cells per femur (c) and colonies produced (d) blue: GMP; green: MDP, orange: MOP, red: GP; n = total 3 mice in two experiments) for progenitors isolated as published16,19 (diamonds) or as shown in b (circles). e, Frequencies for the indicated populations in sternum by FACS (white) or imaging (orange). n = total 3 mice in three experiments. f, Images of the different progenitors. g, FACS gates for isolation and imaging of the indicated progenitors. h, i, Images showing the different myeloid cells. For all panels scale bar = 10 µm. Statistical differences were calculated using two-tailed Student’s T tests. ns = not significant.
