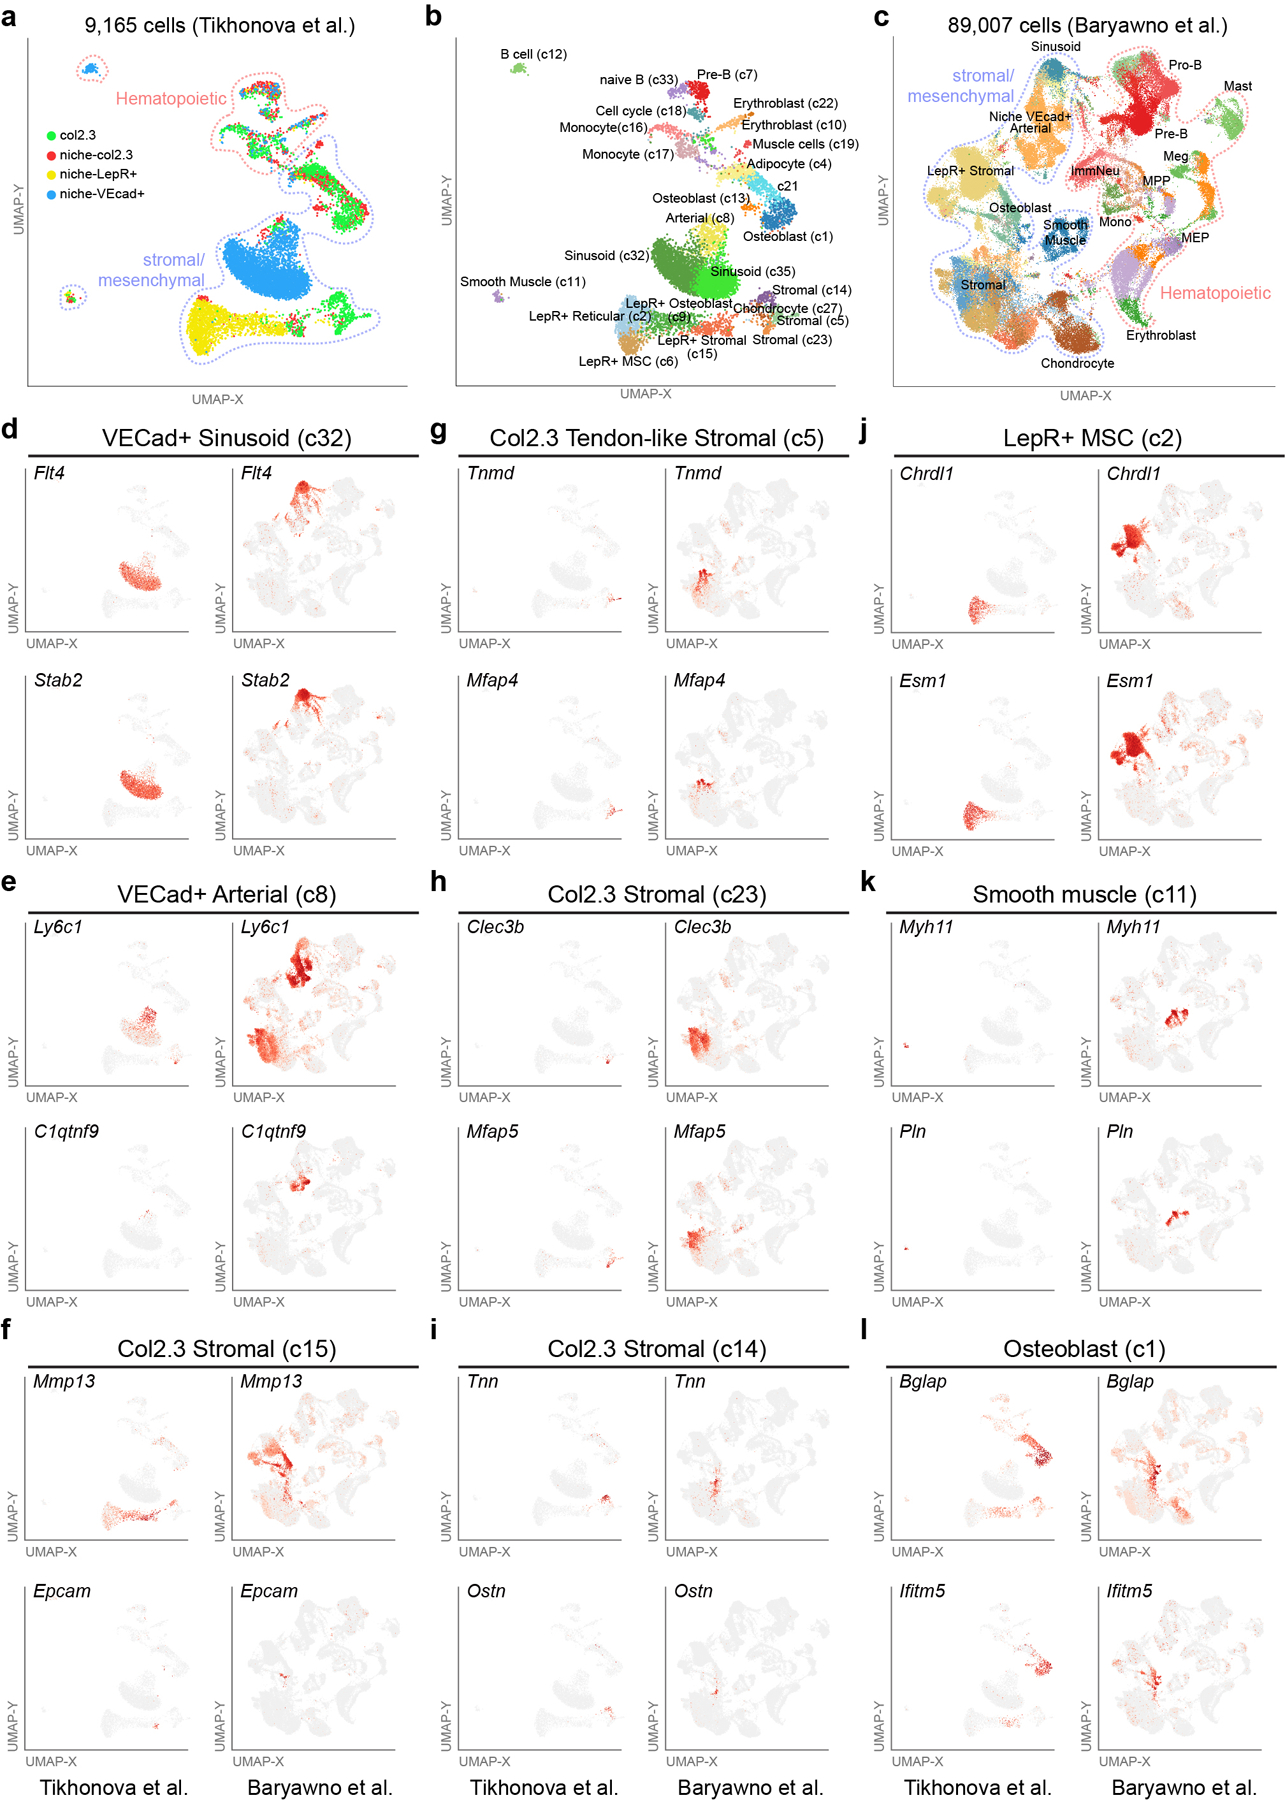
Extended Data Figure 6. Broad comparison of stromal bone marrow compartments by single-cell RNA-Seq.

Comparative analyses of two previously described scRNA-Seq datasets profiling stromal and hematopoietic cell population in bone marrow (9,165 cells from Tikhonova et al. and 89,007 cells Baryawno et al.). a-c, Cell population predictions displayed on a UMAP plot from an unsupervised analysis of the two separate scRNA-Seq datasets (ICGS version 2). Distinct captures are denoted by the gating strategy (col2.3, niche col2.3, niche-LepR+, niche VEcad+). Populations are denoted as hematopoietic or stromal/mesenchymal based on prior-defined scRNA-Seq cell population marker gene signatures (ICGS – see cluster labels). d-l, Relative expression of ICGS2 cell-population marker genes (identified in both datasets) projected on to the two UMAP plots to verify cell identity, relative to capture strategy. Supplementary Table 2 shows the different ICGS2 marker genes and Cell barcode assignments for the difference cell clusters identified.
