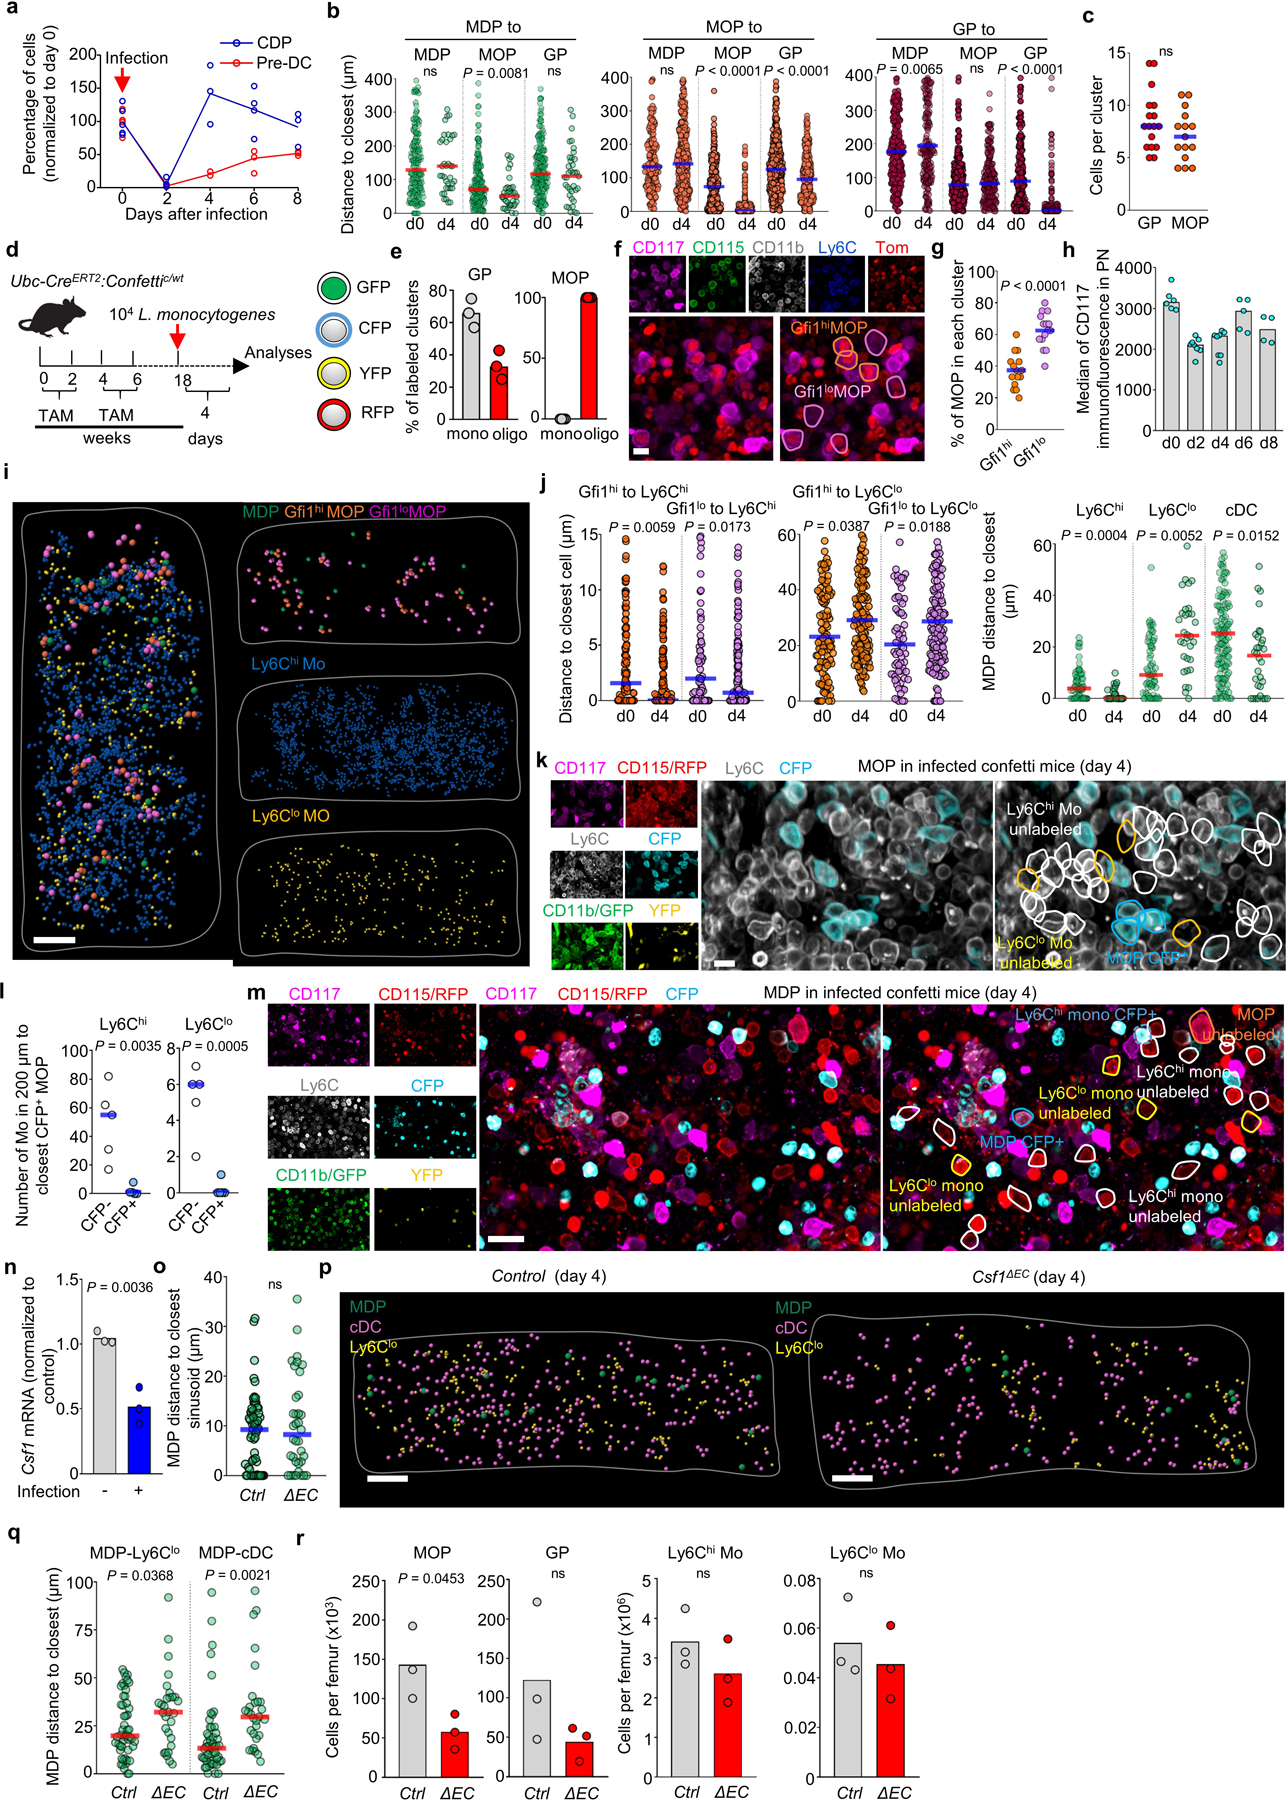
Extended Data Figure 9. Changes in progenitor localization after infection.

a, Average percentage of the indicated cells per femur (normalized to day 0) at the indicated time points after L. monocytogenes infection of wild-type mice. (n = 6 mice for day 0 and day 2, n = 3 mice for day 4, n = 4 mice for day 6 and n = 3 mice for day 8). b, Histograms showing the distribution of distances from each MDP (green, n = 188 MDP from total 16 sternum sections of 6 uninfected wild-type mice and n = 37 MDP from total 3 sternum sections of 3 wild-type mice four days after L. monocytogenes infection), MOP (orange, n = 165 MOP from total 4 sternum sections of 3 uninfected wild-type mice and n = 377 MOP from total 3 sternum sections of 3 wild-type mice four days after L. monocytogenes infection) or GP (red, n = 308 GP from total 14 sternum sections of 6 uninfected wild-type mice and n = 218 GP from total 3 sternum sections of 3 wild-type mice four days after L. monocytogenes infection) to the indicated progenitors four days after L. monocytogenes infection of wild-type mice. c, number of GP or MOP per cluster for the sternum sections analyzed in b. Each dot represents a cluster; n = 16 GP clusters and n = 15 MOP clusters from total 3 wild-type mice four days after L. monocytogenes infection. d, Experimental design for in vivo fate mapping using Ubc-creERT2:confetti mice. e, Percentage of GP or MOP clusters with at least 1 confetti labeled GP or MOP that are monoclonal (all cells in the cluster are labeled in the same confetti color) or oligoclonal (containing cells with at least two different origins: CFP+, YFP+, or no confetti label). Each dot represents a GP or MOP cluster from total 3 sternum segments from 2 confetti mice in two experiments four days after L. monocytogenes infection. f, Representative image showing a cluster composed of MDP-derived Gfi1lo and GMP-derived Gfi1hi MOP in Gfi1-tomato mice four days after L. monocytogenes infection. Scale bar = 10 μm. g, Percentage of GMP-derived Gfi1hi MOP (orange dots) or MDP-derived Gfi1lo MOP (purple dots) per cluster (each dot = 1 cluster, n = 15 clusters in total 3 sternum sections from 2 Gfi1-tomato mice four days after L. monocytogenes infection). h, Quantification of CD117 expression in PN of wild type mice at the indicated time points after infection. (n = 6 mice for day 0, n = 8 mice for day 2 and day 4, n = 5 mice for day 6 and n = 4 mice for day 8). i, Map showing the location of Gfi1hi and Gfi1lo MOP, MDP, Ly6Chi, and Ly6Clo monocytes in a sternum segment from Gfi1-tomato mice four days after infection. Scale bar = 200 μm. j, Histograms showing the distribution of distances from each Gfi1hi (orange) and Gfi1lo (purple) MOP and MDP (green) to the indicated cells in uninfected wild-type mice or four days after L. monocytogenes infection. Note that the d0 values are the same as shown in Fig. 2g,i. (n = 113 Gfi1hi MOP and n = 72 Gfi1lo MOP from total 3 sternum sections of 3 uninfected Gfi1-tomato mice; n = 155 Gfi1hi MOP and n = 144 Gfi1lo MOP from total 3 sternum sections of 2 Gfi1-tomato mice four days after L. monocytogenes infection; MDP-Ly6Chi monocyte, n = 67 MDP from total 6 sternum sections of 4 mice; MDP-Ly6Clo monocyte, n = 67 MDP from total 6 sternum sections of 4 wild-type uninfected mice; MDP-cDC, n = 139 MDP from total 11 sternum sections of 6 wild-type uninfected mice; and n = 32 MDP from total 3 sternum sections of 3 wild-type mice four days after L. monocytogenes infection). k, Representative image showing lack of contribution of a confetti-labeled MOP. Tracked cells are YFP+, CFP+ or unlabeled CD117+CD115+CD11b-Ly6C+ MOP, CD117-CD115+CD11b+Ly6Chi monocytes and CD117-CD115+CD11b+Ly6Clo monocytes. Scale bar = 10 μm. l, Quantification of cell numbers for CFP- (white) and CFP+ (blue) Ly6Chi monocytes (left) or Ly6Clo monocytes (right) found within the indicated distances to the closest CFP+ MOP cell in the confetti mice four days after L. monocytogenes infection. Each dot represents one CFP+ MOP from total 8 sternum segment of 2 confetti mice in two experiments four days after L. monocytogenes infection. m, Representative image showing lack of contribution of a confetti-labeled MDP to surrounding monocytes. Tracked cells are YFP+, CFP+ or unlabeled CD117+CD115+CD11b-Ly6C- MDP, CD117+CD115+CD11b-Ly6C+ MOP, CD117-CD115+CD11b+Ly6Chi monocytes and CD117-CD115+CD11b+Ly6Clo monocytes. Scale bar = 20 μm. n, qPCR analyses showing Csf1 mRNA levels (normalized to not infected) in BM endothelial cells FACS-purified from wild-type mice in the steady-state or 4 days after infection. n = total 3 uninfected mice and n = total 3 infected mice in two experiments. o, Histogram showing the distance from each MDP to the closest sinusoid in control (pool of Cre:Csf1+/−, Csf1+/−, and Csf1fl/-) or Csf1ΔEC mice 4 days after infection. n = 58 MDP from total 4 sternum sections of 3 control mice and n = 36 MDP from total 4 sternum sections of 3 Csf1ΔEC mice. p, q, Maps (p) showing the location of the indicated cells; and histogram (q) showing the distance from each MDP to the closest Ly6Clo monocyte and cDC in control or Csf1ΔEC mice 4 days after infection. n = 51 MDP from total 3 sternum sections of 3 control mice and n = 29 MDP from total 3 sternum sections of 3 Csf1ΔEC mice. r. Number of the indicated cells per femur in control or Csf1ΔEC mice 4 days after infection. Each dot indicates one mouse. n = 3 control and n = 3 Csf1ΔEC mice. Unless otherwise indicated for all panels one dot = one cell. Statistical differences were calculated using two-tailed Student’s T tests and p values are shown. ns = not significant.
