
Extended Data Figure 10. Architecture of myelopoiesis in the steady-state and after infection.
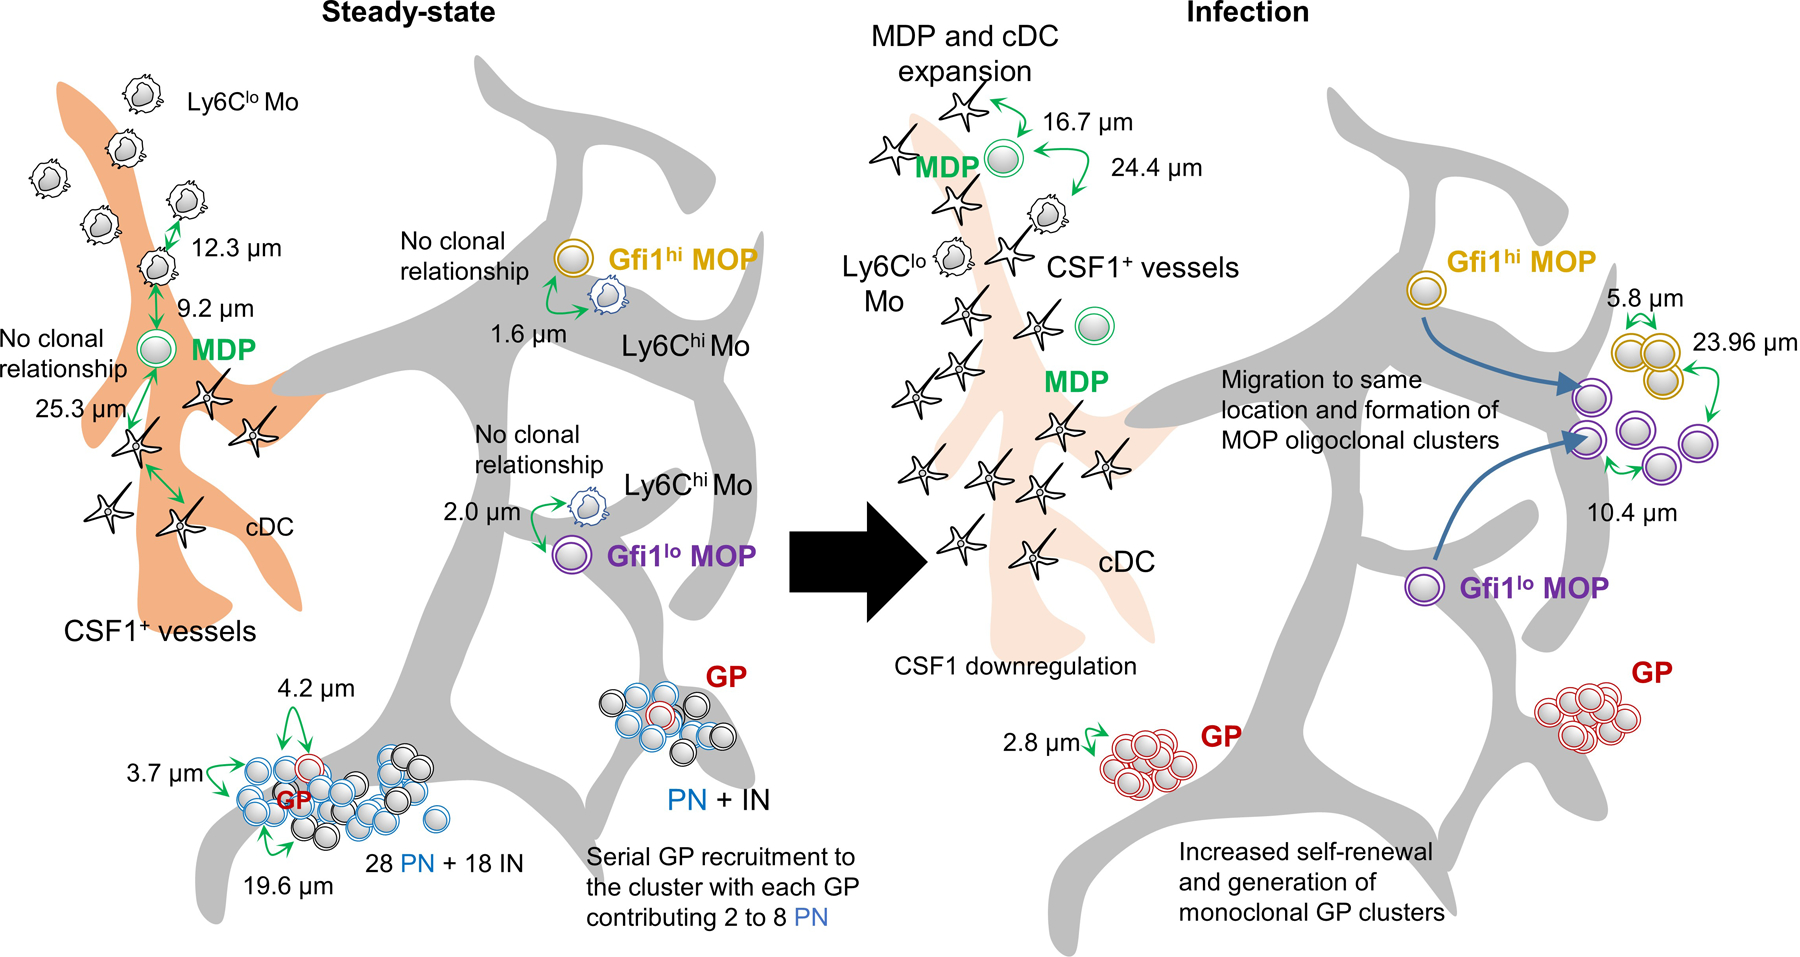
The models show the spatial distribution and average distances between the indicated cells in the steady-state and four days after infection with Listeria monocytogenes.