
Extended Data Figure 2. Strategies to map myelopoiesis in whole mounted sternum.
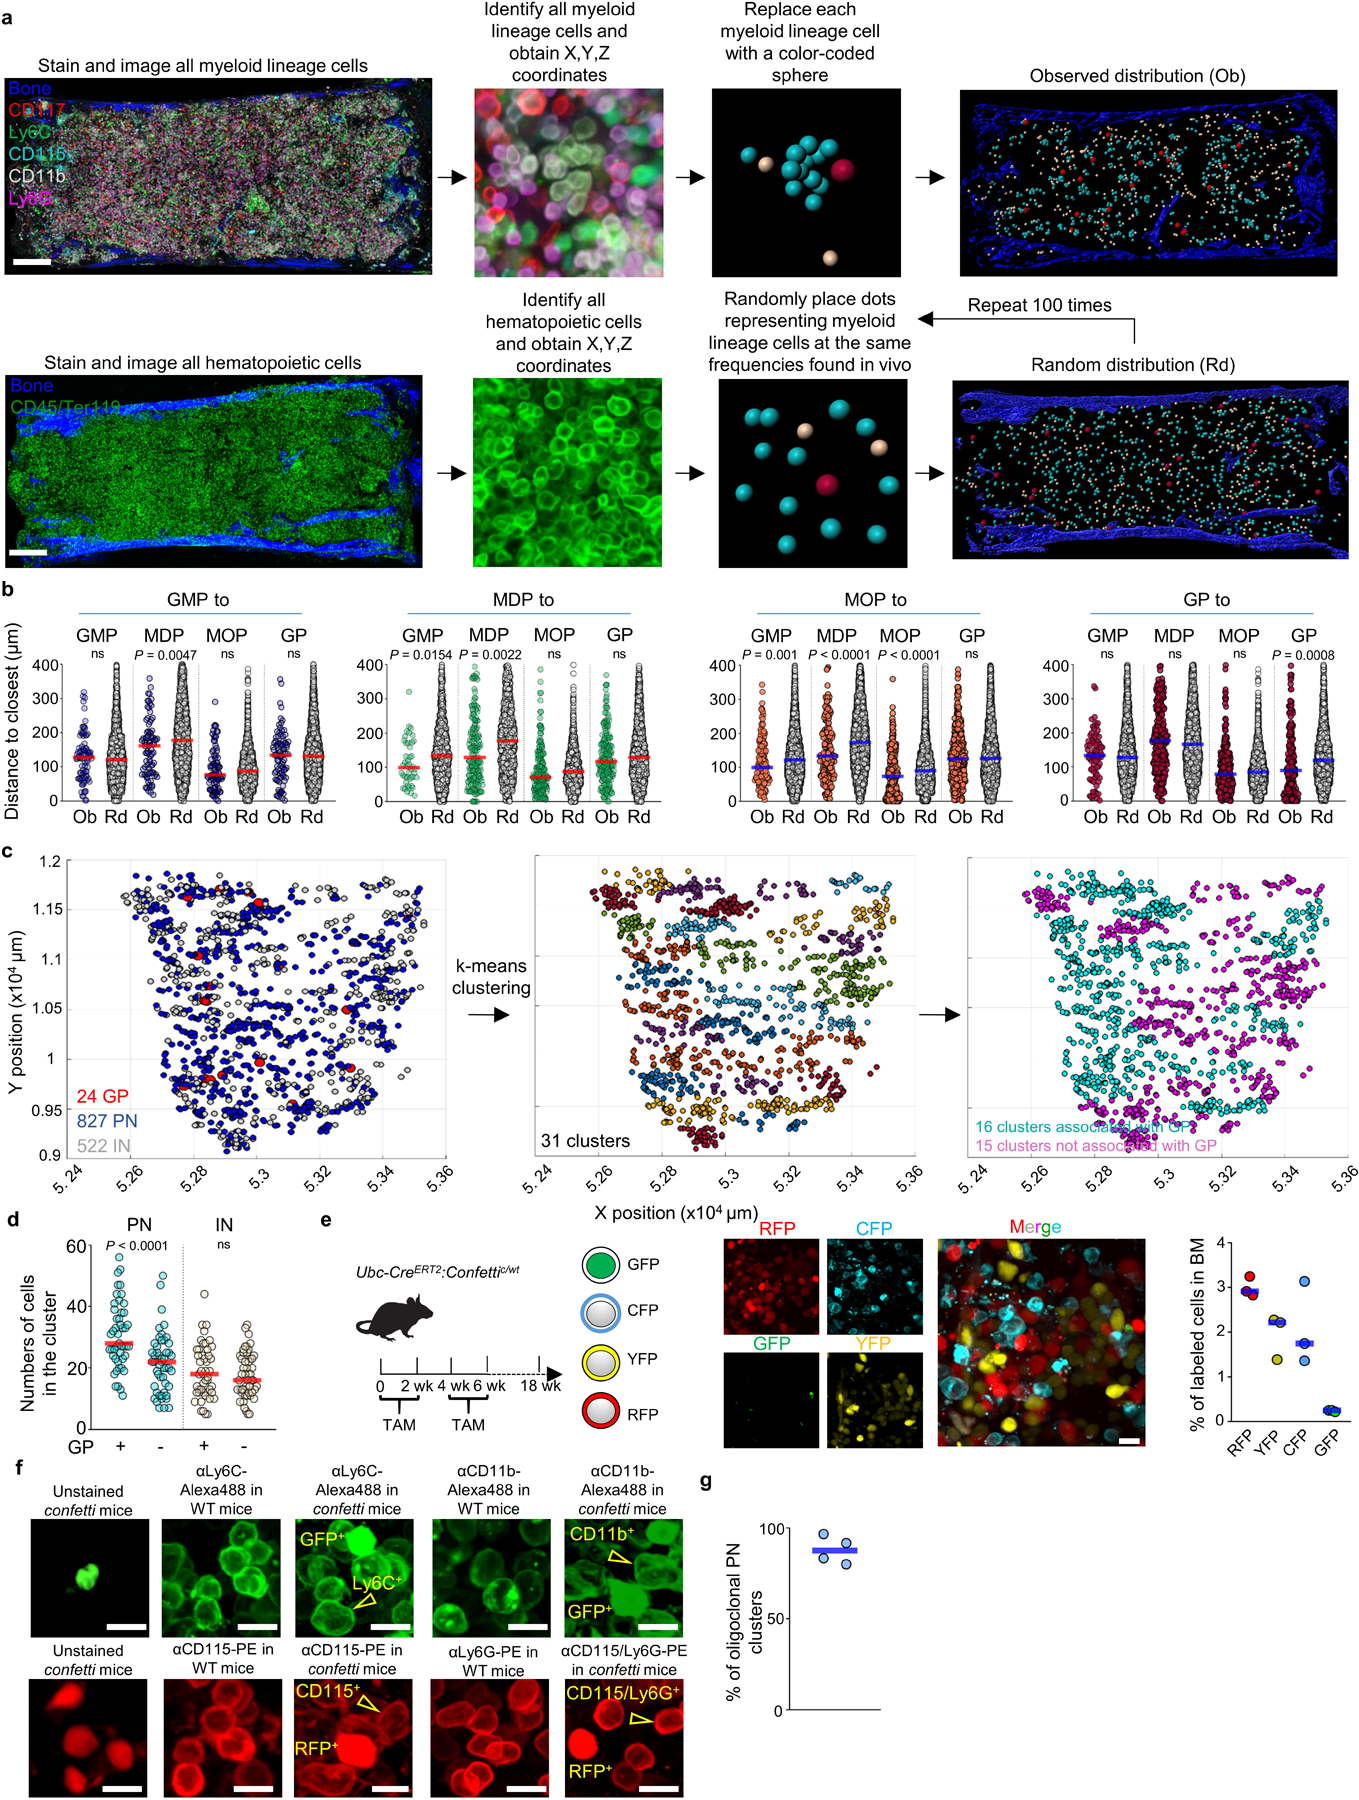
a, Scheme showing the experimental pipeline to identify, obtain the X, Y and Z coordinates, and replace each myeloid cell with a color-coded sphere centered in the cell to better visualize differentiation and to generate random distributions. Scale bar = 200 μm. b, Histograms showing the observed distribution of distances from each GMP (blue), MDP (green), MOP (orange) and GP (red) or random cells (white) to the closest indicated cell (n = 86 GMP from 4 sternum sections of 4 mice, n = 243 MDP from total 23 sternum sections of 15 mice, n = 458 MOP from total 11 sternum sections of 11 mice, n = 338 GP from total 15 sternum sections of 12 mice). c, xy graphs showing the location of GP, PN, and IN in mouse sternum sections (left); the different color coded PN/IN clusters identified using the K-means algorithm (center); and PN/IN clusters containing (pink) or not containing (blue) GP within the cluster. d, Number of PN and IN in each type of cluster. n = 1443 PN from total 3 sternum sections of 3 mice in cluster with GP, n = 1050 PN from total 3 sternum sections of 3 mice in cluster without GP. n = 880 IN from total 3 sternum sections of 3 mice in cluster with GP, n = 866 PN from total 3 sternum sections of 3 mice in cluster without GP. e, Experimental design, representative image, and histogram showing the percentage of CFP, GFP, RFP and YFP positive cells in fate mapping experiments using Ubc-creERT2:confetti mice. Scale bar = 10 μm. Each dot represents one sternum segment from total 3 confetti mice. f, In the confetti model GFP is detected in the nucleus whereas RFP is expressed in the cytoplasm21. The images show that by using antibodies conjugated to fluorochromes (Alexa Flour488 and Phycoerythrin, PE) that spectrally overlap with GFP or RFP but that stain only the membrane we could distinguish CD11b-Alexa488+GFP-, Ly6C-Alexa488+GFP- cells from GFP+ cells and CD115-PE+RFP-, and Ly6C-PE+RFP- from RFP+ cells. This allowed us to examine the relationships between YFP- or CFP-labeled cells. Since we could not distinguish the membrane signal from the nuclear/cytoplasmic signal in GFP+ or RFP+ cells these were discarded from the analyses. Scale bar = 10 μm. g, Percentage of PN clusters with at least 1 confetti-labeled PN that are oligoclonal (containing cells with at least two different origins: CFP+, YFP+, or no confetti label). Each dot represents one sternum segment from total 3 confetti mice. Statistical differences were calculated using two-tailed Student’s T tests and p values are shown. ns = not significant.