
Extended Data Figure 5. Myeloid progenitor interaction with the microenvironment and HSC.
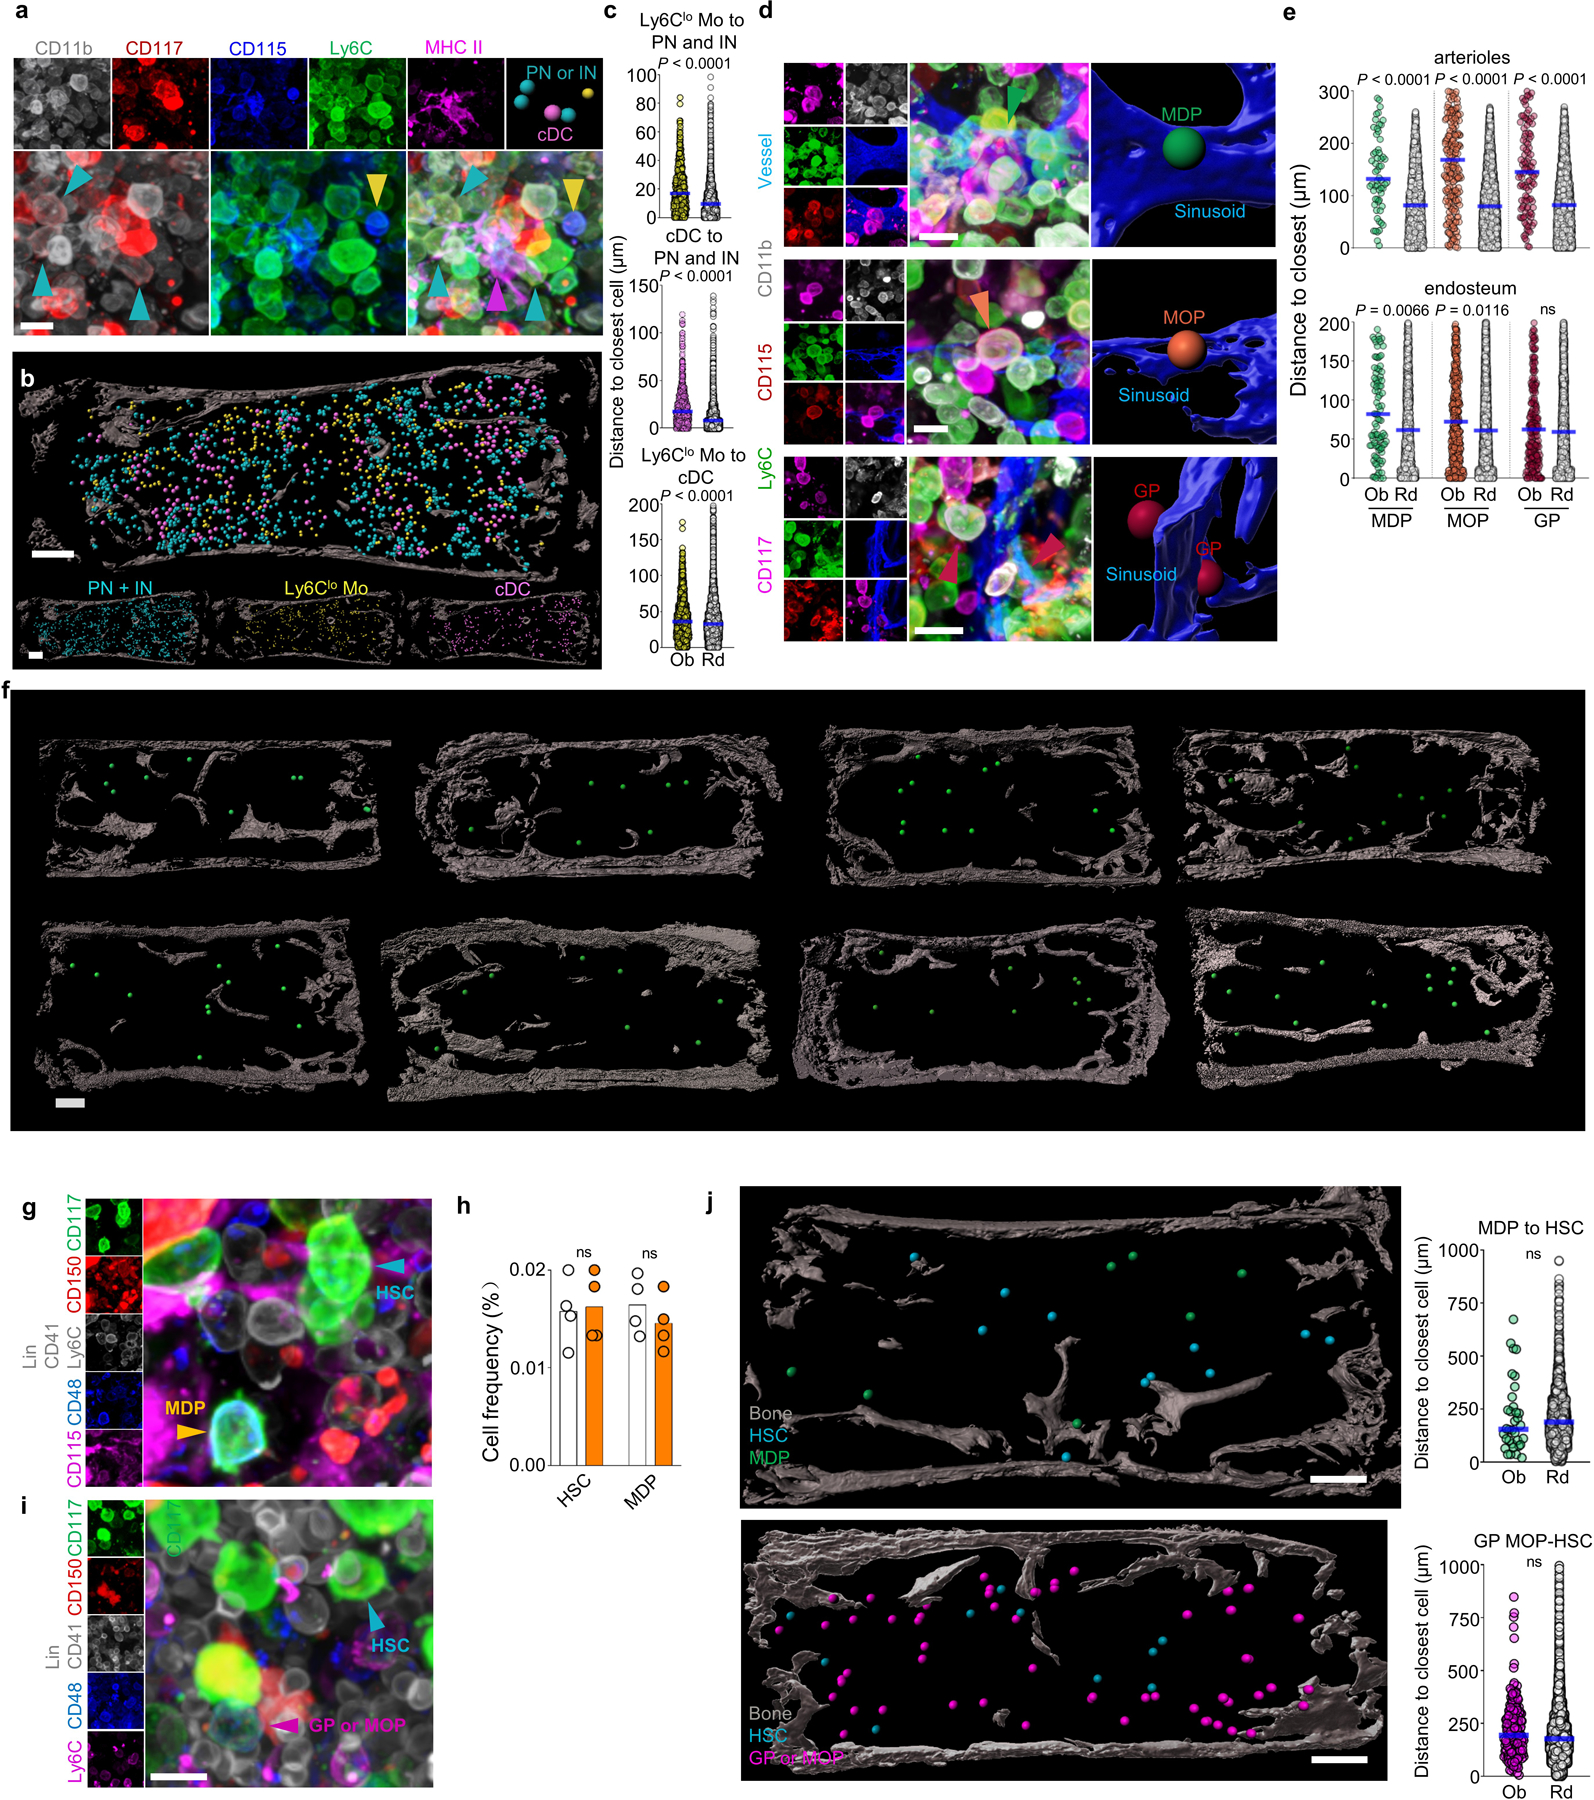
a, Representative image showing simultaneous detection of Pre- and Immature neutrophils, Ly6Clo monocytes and cDC. Scale bar = 10 μm. b, Map showing the location of the indicated cells in the bone marrow. Each dot corresponds to one cell. Note that the radius of each dot is 2x the average radius of the cell. Scale bar = 200 μm. c, Histograms showing the distance from each Ly6Clo Mo (yellow dots) or cDC (pink dots) and their random simulation (white dots) to the closest indicated cell (Ly6Clo to PN/IN, n = 500 Ly6Clo; cDC to PN/IN, n = 727 cDC; Ly6Clo to cDC, n = 1322 Ly6Clo Mo; from total 3 sternum sections of 3 mice). d, High-power images showing the relative positions of MDP, MOP, GP and sinusoids. Scale bar = 10 μm. e, Histograms showing the distance from each MDP (green dots), MOP (orange dots), GP (red dots) or random distribution (white dots) to the closest indicated structure (for distances to arterioles: n = 62 MDP from total 6 sternum sections of 6 mice; n = 218 MOP, and n = 114 GP from total 5 sternum sections of 5 mice; for distances to endosteal surface n = 98 MDP, n = 410 MOP, n = 217 GP, from total 9 sterna of 6 mice). f, Representative images of multiple sternum segments showing that MDP are evenly distributed through the bone marrow, consistent with their sinusoidal location. Scale bar = 200 μm. g, Representative image showing detection of HSC and MDP in a single stain. Scale bar = 10 μm. h, Quantification of MDP and Lin- CD117+CD48-CD41dimCD150+ HSC in femurs by FACS (white) or imaging (orange) analyses. Each dot corresponds to one mouse femur or sternum image. n = 4. i, Representative image showing detection of HSC and a population containing CD117+Ly6C+ GP and MOP in a single stain. Scale bar = 10 μm. j, Maps and histograms showing the relationships between HSC and MDP or GP/MOP in the bone marrow. In the map the dot radius is three times the average cell radius. Scale bar = 200 μm. (n = 35 MDP from total 4 sternum sections of 3 mice and n = 191 GP and MOP from total 3 sternum sections of 3 mice). Unless otherwise indicated for all graphs one dot corresponds to one cell. Horizontal blue bars indicate the median distance. Statistical differences were calculated using two-tailed Student’s T tests and p values are shown. ns = not significant.