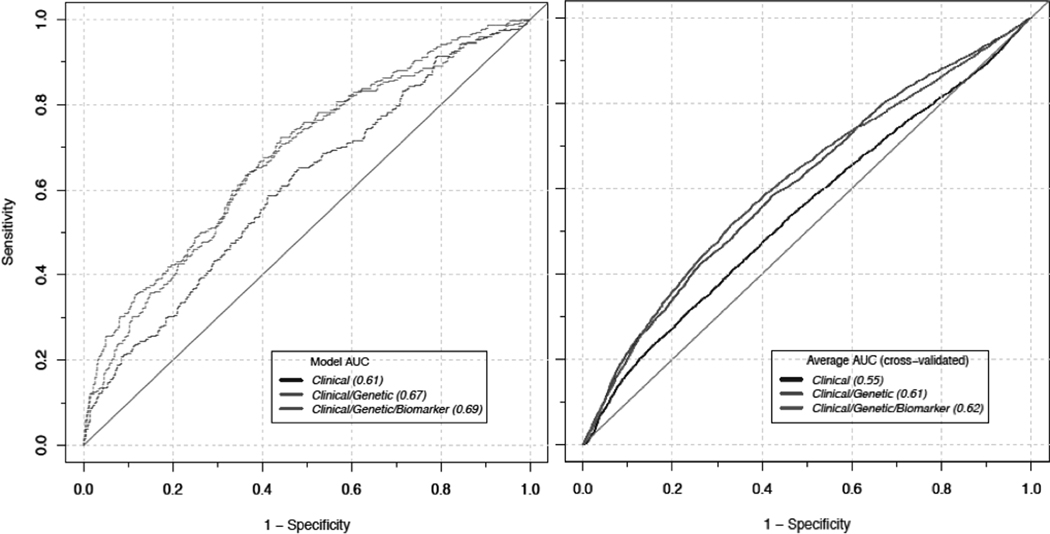
Figure 1.
ROC curves from before (left) and after 5-fold cross validation (right) in the 0–10 years follow-up population. Each line represents the clinical model (navy), the clinical/genetic model (green), and the clinical/genetic/biomarker model (red). The 5-fold cross validation leaving out 20% randomly selected dataset as a test set at a time was performed 20 times. The average AUC was calculated as a mean of 100 AUC values estimated in the test datasets.

