
FIGURE 3.
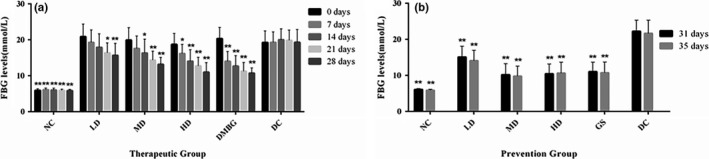
Effect of phlorizin on FBG levels. FBG levels of therapeutic groups (a) and FBG levels of prevention groups (b), compared with DC. *p < .05, **p < .01
Official websites use .gov
A
.gov website belongs to an official
government organization in the United States.
Secure .gov websites use HTTPS
A lock (
) or https:// means you've safely
connected to the .gov website. Share sensitive
information only on official, secure websites.
Effect of phlorizin on FBG levels. FBG levels of therapeutic groups (a) and FBG levels of prevention groups (b), compared with DC. *p < .05, **p < .01