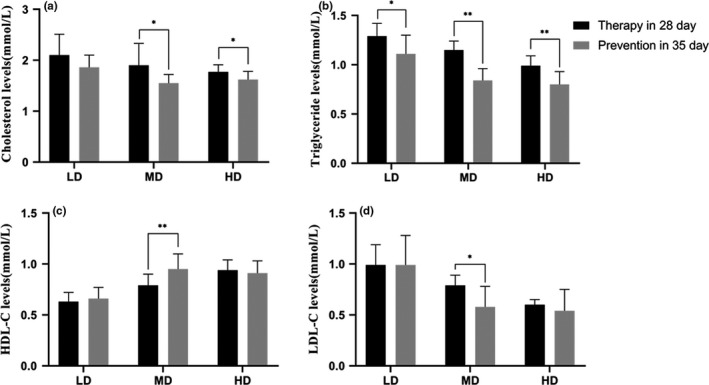
FIGURE 6.

Effects of phlorizin on blood lipid levels at 35th day in prevention compared with at 28th day in therapeutic experiment. TC levels (a), TG levels (b), LDL‐C levels (c), and HDL‐C levels (d), 35th day in prevention compared with 28th day in therapeutic experiment on the same index. *p < .05, **p < .01
