FIGURE 1.

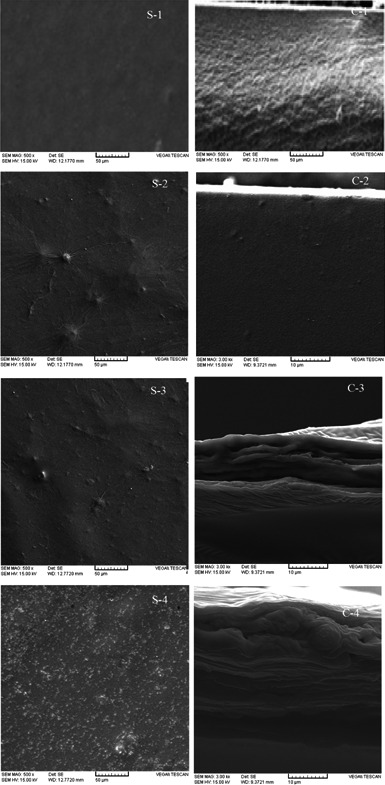
The SEM images of SiO2‐free SSPS (S1 and C1), SSPS/SiO2 1% (S2 and C2), SSPS/SiO2 3% (S3 and C3), and SSPS/SiO2 5% (S4 and C4). The letters of C and S stand for “cross‐section” and “surface” profiles of the composites, respectively

The SEM images of SiO2‐free SSPS (S1 and C1), SSPS/SiO2 1% (S2 and C2), SSPS/SiO2 3% (S3 and C3), and SSPS/SiO2 5% (S4 and C4). The letters of C and S stand for “cross‐section” and “surface” profiles of the composites, respectively