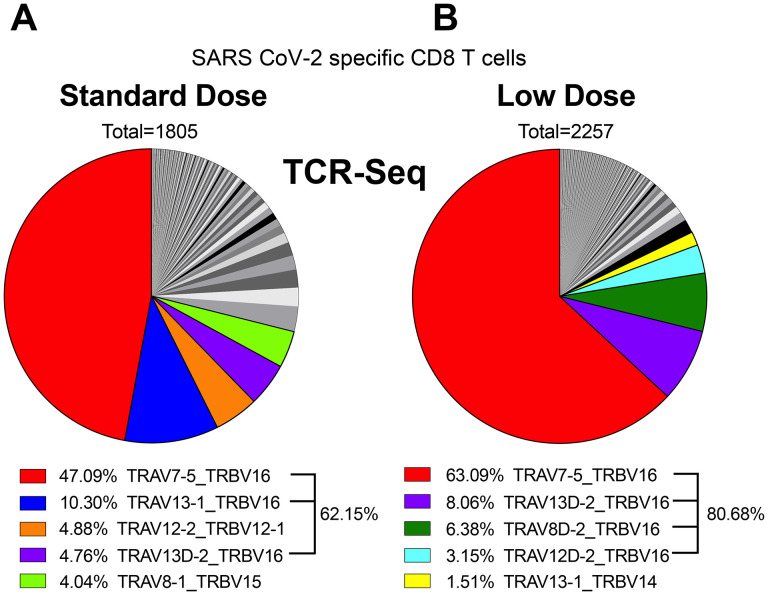
Figure 4. Single cell TCR-seq analyses demonstrate that the prime dose does not alter public TCR clonotypes.
Mice were primed with a LD (106 PFU) or a SD (109 PFU) of Ad5-SARS-2 spike, and at day 28, splenic CD8 T cells were MACS-sorted. Subsequently, live, CD8+, CD44+, Kb VL8+ cells were FACS-sorted to ~99% purity for scTCR-Seq. Pie chart showing the distribution of TCRa and TCRb gene usage after SD prime (A) and LD prime (B). Total number above the pie chart show the number of single cells selected for the analyses, and different colors highlight the top 5 TCR usages and their relative proportion in each population.

