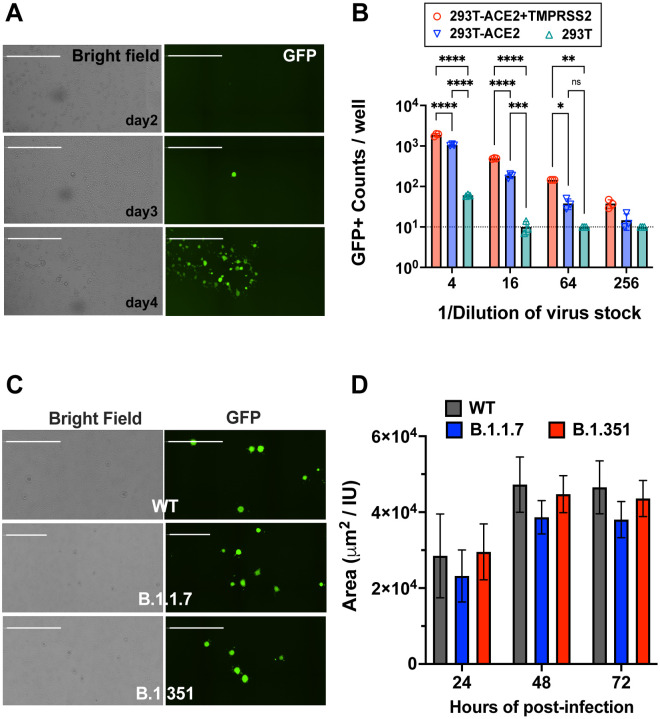
Figure 1. Replication-competent VSV bearing wild-type and variant SARS-CoV-2 spike (rcVSV-CoV2-S).
(A) Representative images of de novo generation of rcVSV-CoV2-S, carrying an EGFP reporter, in transfected 293T-ACE2+TMPRSS2 (F8–2) cells as described in Extended Data Fig. S1. Single GFP+ cells detected at 2–3 days post-transfection (dpt) form a foci of syncytia by 4 dpt. Images are taken by Celigo imaging cytometer (Nexcelom) and are computational composites from the identical number of fields in each well. White bar is equal to 1 millimeter. (B) Entry efficiency of rcVSV-CoV2-S in parental 293T cells, 293T stably expressing ACE2 alone (293T-ACE2) or with TMPRSS2 (293T-ACE2+TMPRSS2). Serial dilutions of virus stocks amplified on Vero-TMPRSS2 cells were used to infect the indicated cell lines in 96-well plates in triplicates. GFP signal was detected and counted by a Celigo imaging cytometer (Nexcelom) 10 hours post-infection. Symbols are individual data points from triplicate infections at the indicated dilutions. Bars represent the average of 3 replicates with error bars indicating standard deviation. A two-way ANOVA was used to compare the differences between cell lines at any given dilution. Adjusted p values from Tukey’s multiple comparisons test are given (ns; not significant, * p < 0.05, ** p < 0.01, *** p < 0.001, **** p < 0.0001). (C) rcVSV-CoV-2-S containing the prevailing WT (D614G) and VOC (B.1.1.7 and B.1.351) spikes were inoculated into one 6-well each of F8–2 cells (MOI 0.1) and subsequently overlaid with methylcellulose-DMEM to monitor syncytia formation. Representative images of syncytial plaques at 48 hpi are shown. White bar equals 1 millimeter. (D) shows the growth of GFP positive area / infectious unit (IU) in the 6 well plate. GFP positive areas were imaged and measured by the Celigo imaging cytometer. IU was checked at 10 hpi in the same well. Bar shows the average of 3 independent experiments with error bar indicating standard deviation. No statistically significant differences were detected between WT and VOC spikes in the size of GFP+ syncytia at any given time point (two-way ANOVA as above, ‘ns’ not indicated in graph).

