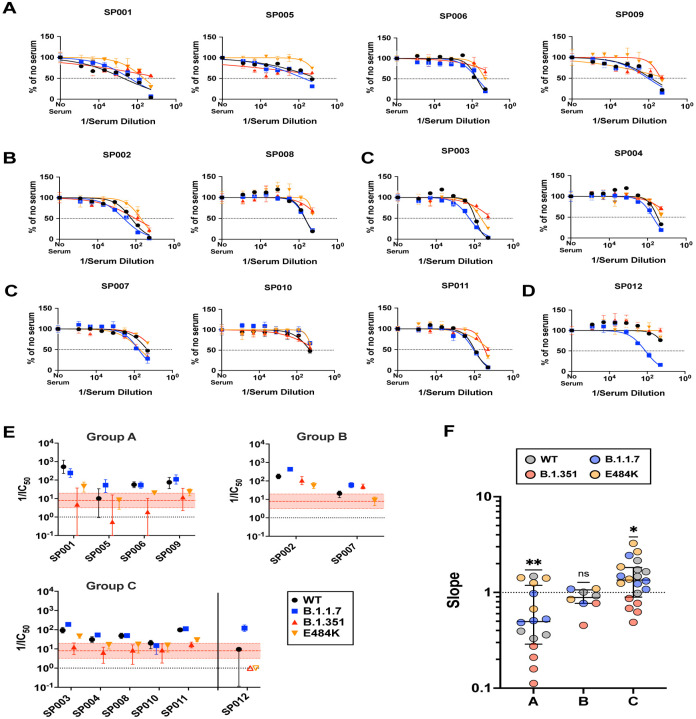
Figure 3. Sputnik vaccine recipients generate qualitatively different neutralizing antibody responses against SARS-CoV-2.
(A-C) Group A (SP001, SP005, SP006, SP012), Group B (SP002, SP007), and Group C (SP003, SP004, SP008, SP010, SP011) represent potentially distinct classes of virus neutralizing activity present in the sera samples analyzed. Full neutralization curves for all sera tested against all viruses bearing the variant and mutant spike proteins are shown. (D) shows a singular example of a serum that only neutralized the B.1.1.7 spike. (E) graphs the serum neutralizing titers (SNT = 1/IC50) and 95% CI that can be extrapolated from the nonlinear regression curves shown for all the sera samples analyzed. Colored filled symbols represent the indicated viruses, open symbols in (E) represent assigned SNT values of 1.0 when no significant neutralization activity could be detected (SP012, B.1.351 and E484K). The dotted black line represents a reciprocal serum dilution of 1.0. The red dashed line and shaded boundaries represent the geometric mean titer and 95% CI, respectively, for B.1.351. (F) The Hill slope values for all the neutralization curves are aggregated according to their groups. The different colored symbols in each group represent the indicated virus tested. P values are from a non-parametric Wilcoxon signed rank test using a theoretical median of 1.0.

