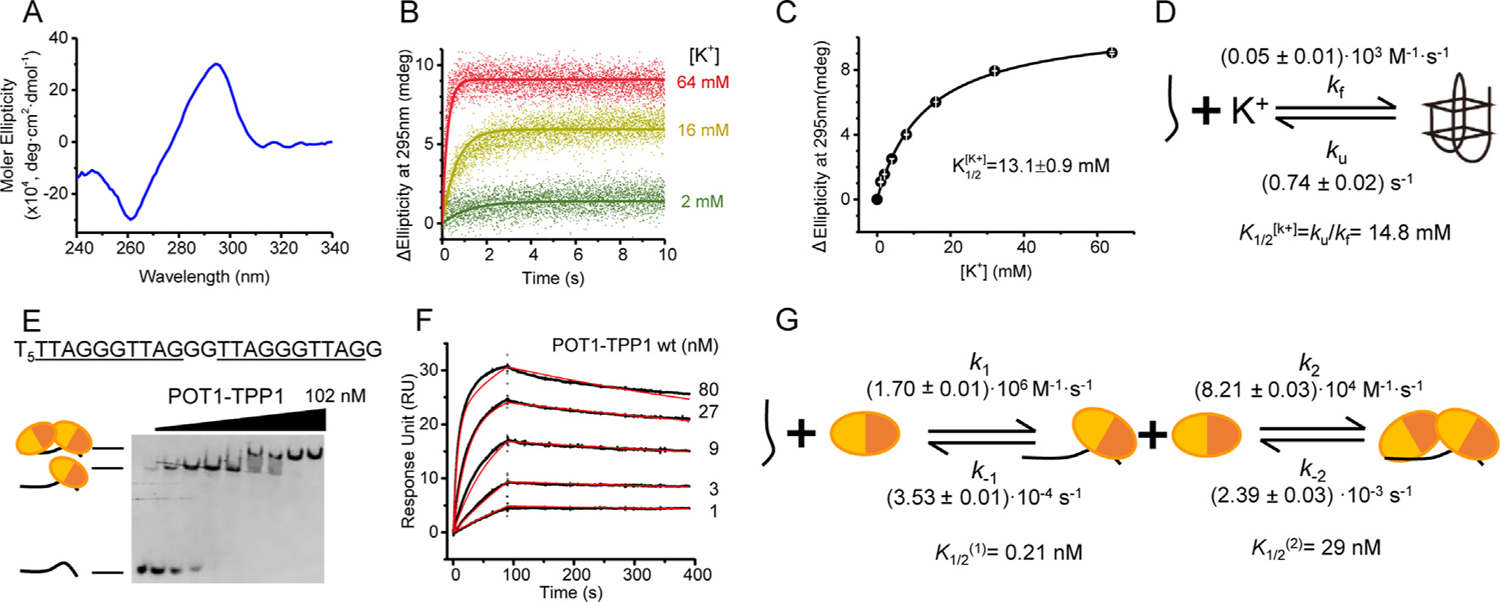
Figure 1.

POT1-TPP1 binds unstructured 6ThT22 with two distinct binding affinities. (A) CD spectrum of 6ThT22 in K+ highlights signature peak (295 nm) and valley (260 nm) indicative of antiparallel G4 topology. (B) Time traces of ellipticity at 295 nm to monitor the folding of 6ThT22 into G4 structures with increasing concentrations of K+. (C) G4 formation of 6ThT22 structure, as monitored in changes at 295 nm ellipticity, as a function of [K+] with . (D) The model for 6ThT22 G4 formation upon mixing with K+ with . (E) EMSA analysis of POT1-TPP1 binding to unfolded 6ThT22 under equilibrium binding conditions in Li+ buffer. 1 nM 6ThT22 with 0–102 nM POT1-TPP1 protein. Substrate sequence of 6ThT22 (shown at top) with tandem POT1-TPP1 binding sites underlined. In the schematic, each circle represents an individual POT1-TPP1 heterodimer, with its separate DNA-binding domains colored in different shades of orange. (F) Sensorgrams displaying the interactions of immobilized 6ThT22 with POT1-TPP1 proteins in Li+ buffer (experimental data shown in black and fitted data shown in red). (G) Kinetic model of SPR data used for calculating individual rate constants of POT1-TPP1 binding to unfolded 6ThT22.
