Figure 3.

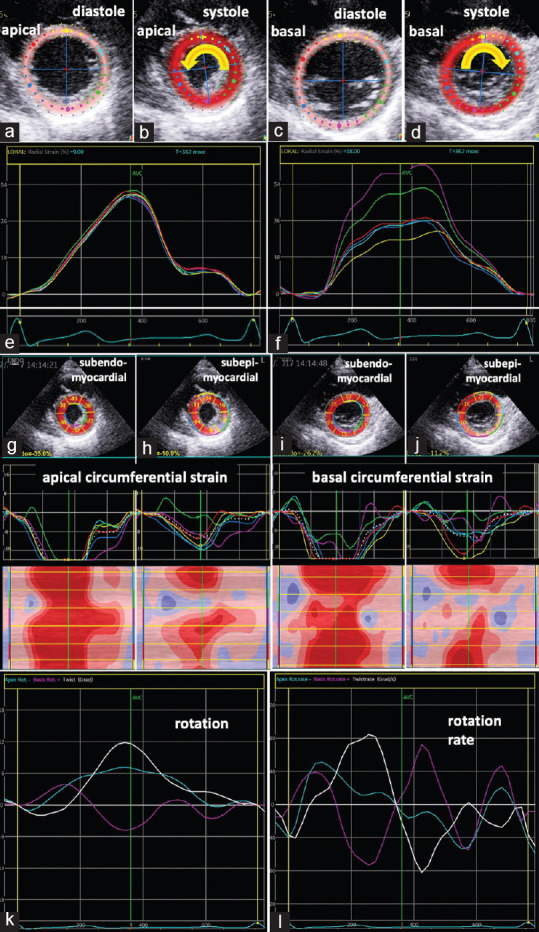
Documentation of echocardiographic findings at follow-up after 6 months: Illustration of the tracking area of apical (a and b) and basal (c and d) left ventricular segments in parasternal short-axis views during diastole (a and c) and systole (b and d) documenting the counterclockwise rotation of the apex (b) and the clockwise rotation of the base (d). Line graphs of increased regional radial deformation of the apical and basal left ventricular segments (e and f). Two-dimensional parasternal short-axis views representing segmental subendo- and subepicardial circumferential deformation (g-j) including segmental strain graphs and color-M-Modes; Conspicuous circumferential strain was only observed subepicardial in the basal and apical lateral left ventricular segments (h and j); line graphs of apical (blue) and basal rotation (magenta) and left ventricular twist (white) (k) as well as corresponding line graphs of rotation rate (l) showed normal apical rotation and biphasic basal rotation as well as still a “chaotic” rotation rate-pattern during diastole (l)
