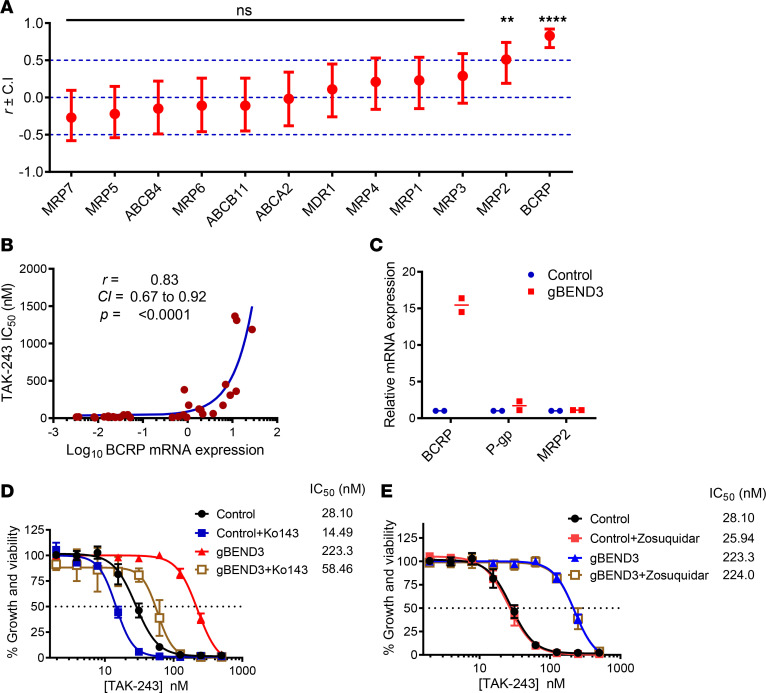
Figure 5. Upregulation of BCRP mediates TAK-243 resistance upon BEND3 knockout in AML cells.
(A) RNA-Seq expression data of 12 ABC transporters were obtained from the Cancer Cell Line Encyclopedia and correlated with TAK-243 sensitivity (as measured by IC50) of 30 cell lines. The x axis represents the ABC transporters, and the y axis represents the value of the linear Pearson correlation coefficient (r) ± upper and lower confidence intervals (CIs) for each transporter. The significance of correlation is shown on the graph. **P ≤ 0.01; ****P ≤ 0.0001. (B) Correlation curve of the mRNA expression of BCRP (ABCG2) and TAK-243 sensitivity (as measured by IC50). Data points represent the 30 cell lines used in the analysis. A logarithmic scale was used for the x axis to display all the data points over a wide range. Inset: the Pearson correlation coefficient (r), CI, and significance of correlation (as assessed by P value). (C) Relative mRNA expression of BCRP, P-gp, and MRP2 in control and BEND3-knockout OCI-AML2-Cas9 cells as assessed by RT-qPCR. Data points represent means of 2 biological replicates (each done in triplicate). (D and E) Control and BEND3-knockout OCI-AML2-Cas9 cells were treated with increasing concentrations of TAK-243 alone and in combination with 0.5 μM Ko143 (D) or 0.5 μM zosuquidar (E) for 72 hours. Cell growth and viability was measured by the MTS assay. Inset: the IC50 values (nM) are shown. Data points represent means ± SEM of 3–4 independent experiments.

