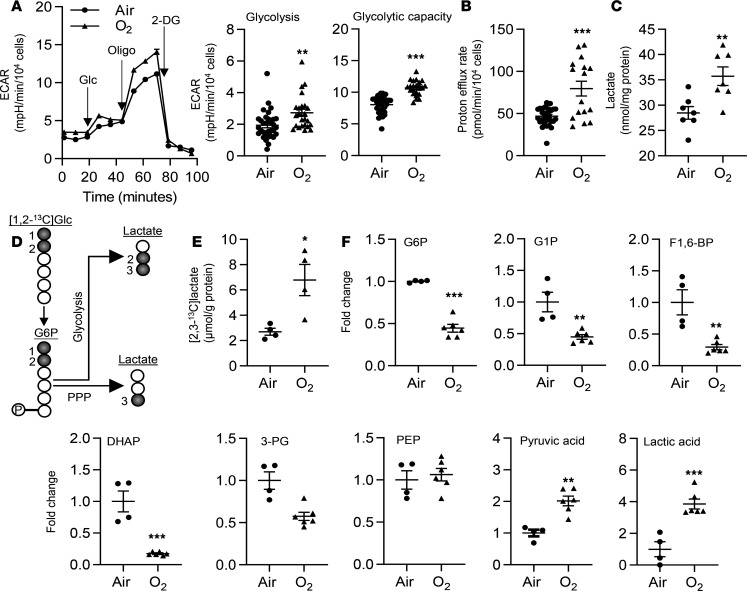
Figure 1. Hyperoxic exposure increases glycolysis in cultured lung ECs.
(A–C, E, and F) Primary LMVECs (A–C, and F) and MFLM-91U cells (E) were exposed to hyperoxia for 24 hours and then cultured in normoxia for 24 hours (refers to O2). (A) ECAR was measured in cells by the Seahorse XF24 Analyzer. Kinetic ECAR response to glucose (Glc), oligomycin (Oligo), and 2-DG was recorded. Basal glycolysis and glycolytic capacity were calculated after normalization into the number of live cells. n = 32 in air and n = 16 in hyperoxia. (B) Glycolytic rate assay was performed to determine glycolysis-derived proton efflux. n = 32 in air and n = 16 in hyperoxia. (C) Intracellular lactate was measured using the L-lactate Assay kit. n = 7 per group. (D) Schematic figure showing the production of [2,3-13C]lactate and [3-13C]lactate from [1,2-13C]glucose via glycolysis and the PPP, respectively. (E) [2,3-13C]lactate was measured by the NMR when cells were incubated with [1,2-13C]glucose (20 mM) for 24 hours during air recovery phase. n = 4 per group. (F) Detectable intracellular metabolites during glycolysis were presented. n = 4 in air and n = 6 in hyperoxia. Data are expressed as mean ± SEM. *P < 0.05, **P < 0.01, ***P < 0.001 versus air using 1-railed t test (A–C, E, and F).

