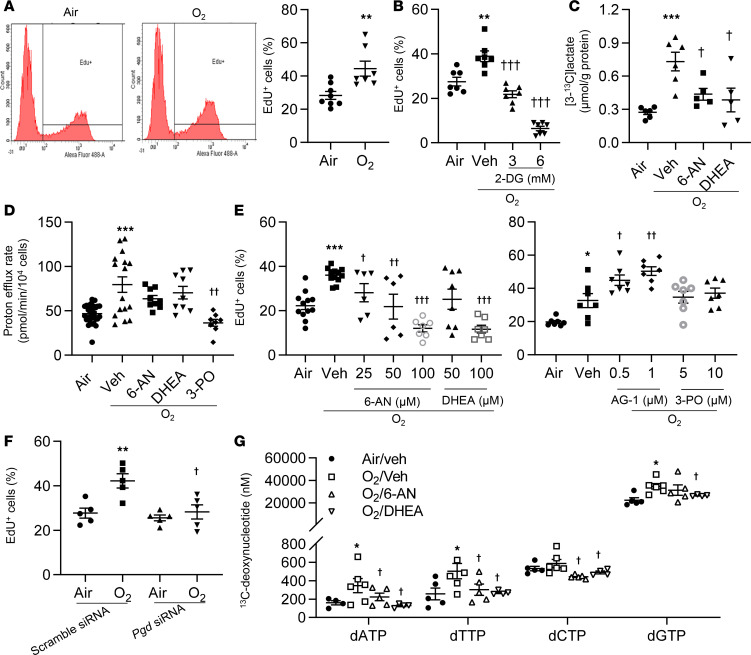
Figure 3. Blocking the PPP reduces hyperoxia-induced proliferation in cultured lung ECs.
(A–G) Primary mouse LMVECs (A, B, D, E, G) or MFLM-91U cells (C and F) were exposed to hyperoxia for 24 hours, followed by normoxia for 24 hours (refers to O2). (A) EdU incorporation was measured by flow cytometry, and a percentage of EdU+ cells was calculated. n = 8 in air and n = 7 in hyperoxia. (B) EdU incorporation was measured by flow cytometry after incubation with 2-DG (3 and 6 mM, 12 hours) during air recovery phase. n = 7 per group. (C) [3-13C]lactate was measured by the NMR when cells were incubated with [1,2-13C]glucose (20 mM, 24 hours) along with 6-AN (50 μM, 12 hours) or DHEA (50 μM, 12 hours) during air recovery phase. n = 6 in air and O2/veh groups; n = 5 in 6-AN and DHEA treatment groups. (D) Glycolytic rate assay was performed after incubation with 6-AN (50 μM), DHEA (50 μM), or 3-PO (10 μM) for 12 hours during air recovery phase. n = 32 in air and O2/veh groups; n = 8 in 6-AN, DHEA and 3-PO treatment groups. (E) EdU incorporation was measured by flow cytometry after incubation with 6-AN (25–100 μM), DHEA (50 and100 μM), and 3-PO (5 and10 μM) for 12 hours during air recovery phase. n = 7 in per group. (F) EdU was measured by flow cytometry in scramble and pgd siRNA–transfected cells. n = 5 in per group. (G) [13C]-labeled deoxynucleotides were measured by mass spectrometry when cells were incubated with 20 mM [U-13C]glucose for 24 hours during air recovery phase. n = 5 per group. *P < 0.05, **P < 0.01, ***P < 0.001 versus air (A–E), scramble siRNA/air (F), or air/veh (G); †P<0.05, ††P < 0.01, †††P < 0.001 versus hyperoxia/vehicle (B–E, and G) or scramble siRNA/hyperoxia (F) using 1-tailed t test (A) or ANOVA followed by Tukey-Kramer test (B–G).

