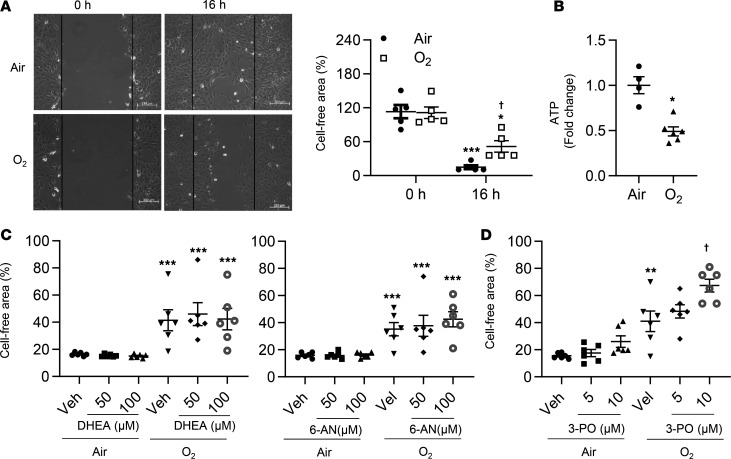
Figure 4. Blocking glycolysis further reduces migration in cultured lung ECs exposed to hyperoxia.
Primary mouse LMVECs were exposed to hyperoxia for 24 hours, followed by normoxia for 24 hours (refers to O2). (A) Scratch assay was performed 16 hours after hyperoxic exposure, and cell-free area was calculated using ImageJ software. n = 5 per group. (B) Intracellular ATP was measured through metabolomics analysis. n = 4 in air and n = 5 in hyperoxia. (C) Scratch assay was performed after incubation with DHEA (50 and 100 μM), 6-AN (50 and 100 μM), or (D) 3-PO (5 and 10 μM) for 12 hours during air recovery phase. n = 6 per group. *P < 0.05, **P < 0.01, ***P < 0.001 versus air/0 hours (A), air (B), or air/veh (C and D); †P < 0.05 versus air/16 hours (A) or hyperoxia/vehicle (D) using 1-tailed t test (B) or ANOVA followed by Tukey-Kramer test (A, C, and D).

