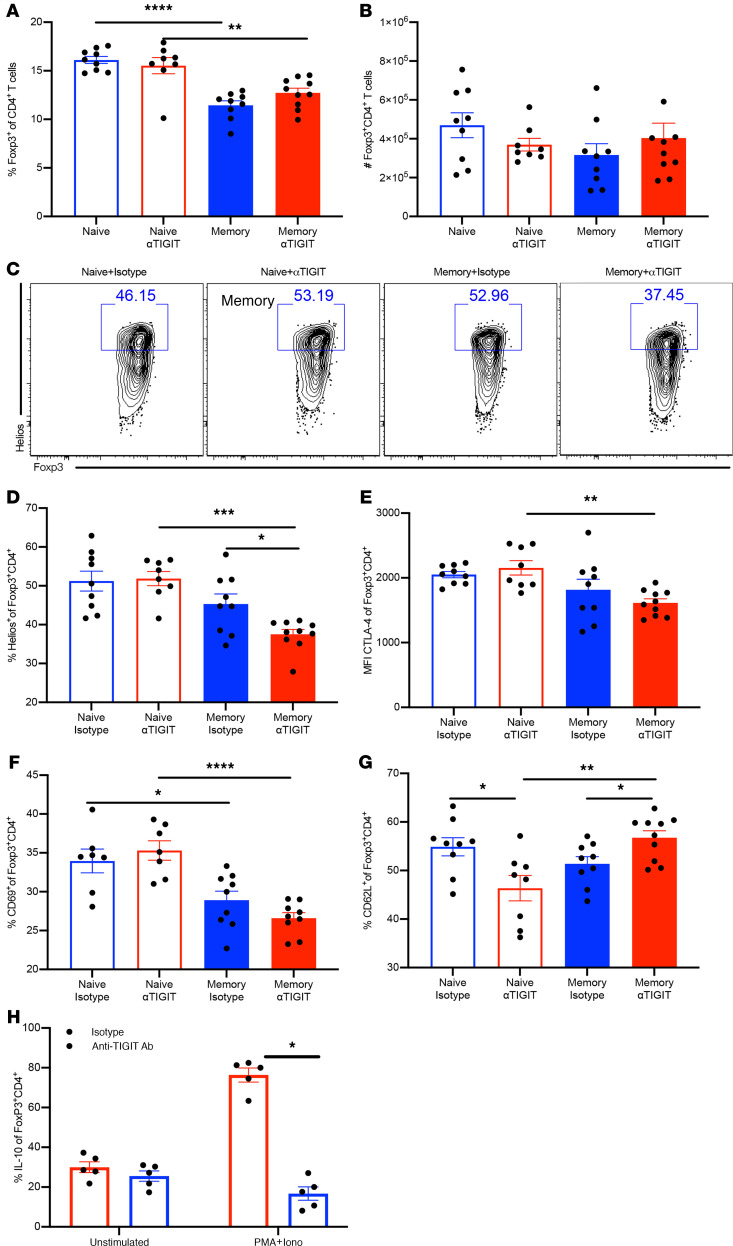
Figure 6. Foxp3+ Tregs from αTIGIT-treated memory mice exhibit deteriorated differentiation and activation.
Splenocytes were harvested at 48 hours after CLP from memory and previously naive septic mice treated with αTIGIT or isotype Ab. (A) Summary data of the percentage of Foxp3+ Tregs in the 4 groups. (B) Absolute numbers of Foxp3+ Tregs among 4 groups. n = 8–9/group. Results were representative of 2 independent experiments. Groups were compared using 1-way ANOVA analysis and Tukey’s multiple comparison test. (C) Representative flow plots depicting Helios expression on CD4+Foxp3+ T cells. (D) Summary data of the percentage of Helios-expressing cells among Foxp3+ Tregs. (E) Summary figure depicting CTLA-4 MFI of Foxp3+ Tregs. (F and G) Summary data of the percentage of CD69+ and CD62L+ cells among Foxp3+ Tregs. (H) Splenocytes from memory septic mice were harvested at 48 hours and restimulated with PMA/ionomycin ex vivo for 4 hours and analyzed for IL-10. Results represent 2 independent experiments. Data are shown as the mean ± SEM. Groups were compared using 1-way ANOVA analysis and Tukey’s multiple comparison test. *P < 0.05, **P < 0.01, ***P < 0.001, ****P < 0.0001.

