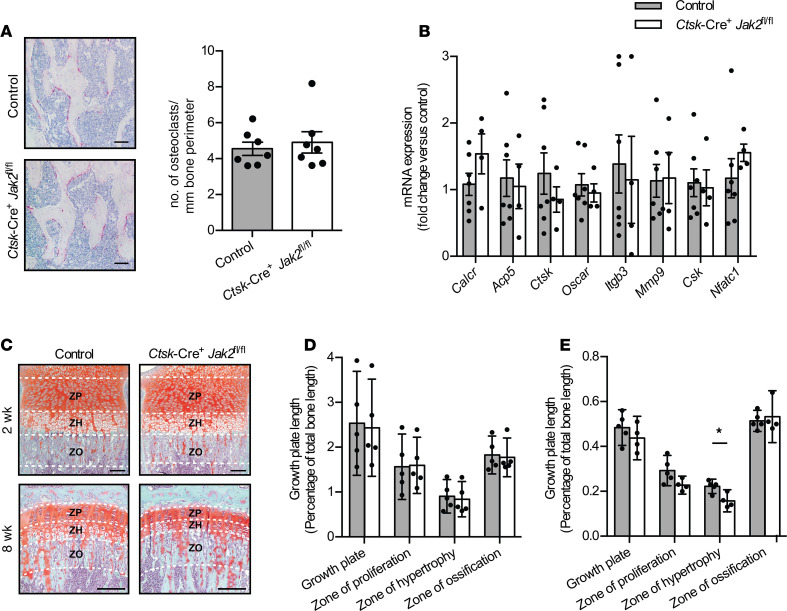
Figure 6. Reduced size of the hypertrophic growth plate zone in Ctsk-Cre+Jak2fl/fl mice.
(A) Representative images of tartrate-resistant alkaline phosphatase–stained (TRAP-stained) sections of distal femurs (left) and quantification of osteoclast number per millimeter of bone perimeter (right) in control (n = 7) and Ctsk-Cre+Jak2fl/fl mice (n = 7). Scale bar: 50 μm. (B) mRNA expression of calcitonin receptor (Calcr), tartrate-resistant acid phosphatase type 5 (Acp5), cathepsin-k (Ctsk), osteoclast-associated receptor (Oscar), integrin β 3 (Itgb3), matrix metalloproteinase 9 (Mmp9), C-terminal Src kinase (Csk), and nuclear factor of activated t cells 1 (Nfatc1) in bone from control (n = 7) and Ctsk-Cre+Jak2fl/fl mice (n = 4). Values are normalized to 18S mRNA levels and presented as fold change over control group. (C) Representative images of Safranin O–stained sections of tibia growth plates from 2- and 8-week-old control [n = 5 (2 weeks), n = 5 (8 weeks)] and Ctsk-Cre+Jak2fl/fl [n = 5 (2 weeks), n = 4 (8 weeks)] mice. ZP, zone of proliferation; ZH, zone of hypertrophy; ZO, zone of ossification; growth plate = ZP + ZH). Scale bars: 100 μm. (D) Quantification of tibia growth plate length relative to total bone length in 2-week-old male and female control (n = 5) and Ctsk-Cre+Jak2fl/fl (n = 5) mice. (E) Quantification of tibia growth plate length relative to total bone length in 8-week-old male and female control (n = 5) and Ctsk-Cre+Jak2fl/fl (n = 4) mice. Data represent mean ± SEM. Differences between groups were analyzed for statistical significance by Student’s unpaired t test; *P < 0.05.

