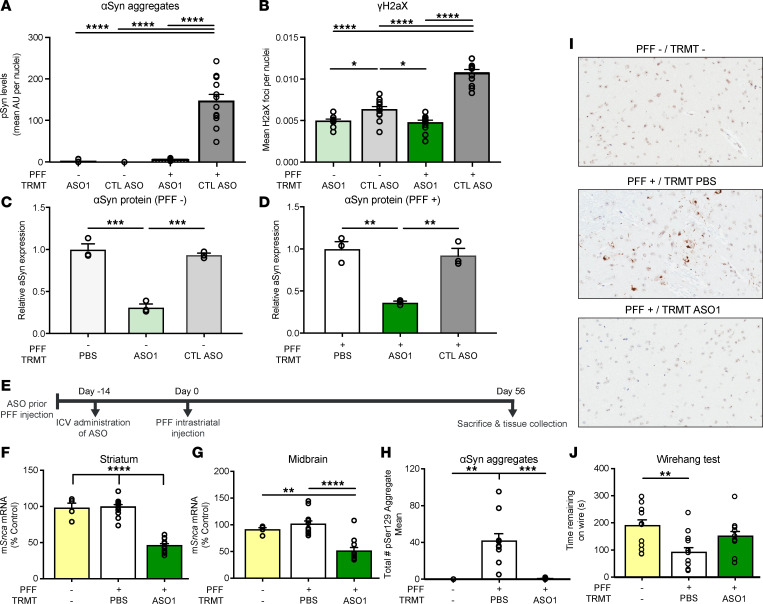
Figure 1. ASO-mediated reduction of Snca improves cellular function in cells and prevents pathogenic aSyn aggregate deposition in an in vivo PFF model of PD.
(A and B) Quantification of pSer129+ area by intensity in mouse primary cortical cultures and cellular function, by γH2AX Ser139, in mouse primary cortical cultures with either CTL ASO or ASO1 30 minutes following PFF addition. Replicated 2 times. (C) Quantification of aSyn protein by Western blot from mouse primary cortical cultures not treated with PFF (n = 3). (D) Quantification of aSyn protein by Western blot from mouse primary cortical cultures treated with PFF. (E) Timeline for single 700 μg i.c.v. bolus ASO administration prior to the PFF injection paradigm with termination at day 56. (F and G) mRNA reduction by RT-PCR in striatum and midbrain. (H) Quantification of pSyn+ aggregate reduction (total enumeration) in the substantia nigra by IHC. (I) Representative images of immunostaining (IHC) for pSer129+ aggregate counts. Original magnification, 100×. (J) Performance on a wire hang task (n = 4, 12, and 11 for naive, PBS, and ASO1, respectively, except wire hang, in which n = 12 for naive). Data are represented as ± SEM. *P < 0.05, **P < 0.01, ***P < 0.001, ****P < 0.0001 (2-way ANOVA with Tukey post hoc analyses for duration of action with all other analyses using 1-way ANOVA with Tukey post hoc analyses). PFF, preformed fibril; TRMT, treatment.

