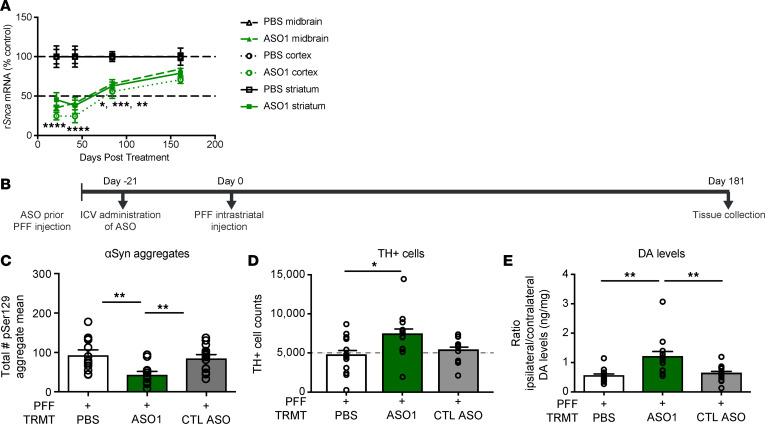
Figure 3. ASO-mediated suppression of Snca exhibits a prolonged duration of action and prevents dopaminergic cell dysfunction in an in vivo PFF model of PD.
(A) Time course of Snca mRNA reduction (the 1000 μg results for the 3-week time point in Figure 2, A–C are included). (B–E) Results from ASO administration (1000 μg) prior to PFF injection paradigm in rats with study termination at 181 days. (B) Timeline for ASO administration prior to PFF injection paradigm in rats. (C–E) pSer129+ aggregate counts using total enumeration by IHC (n = 13, 13, and 15 for PBS, ASO1, and CTL ASO, respectively), dopaminergic cell counts by IHC (by stereology) (n = 13, 13, and 12 for PBS, ASO1, and CTL ASO, respectively), and striatal dopamine levels by HPLC normalized to the contralateral side (n = 13, 13, and 14 for PBS, ASO1, and CTL ASO, respectively). Data are represented as ± SEM. *P < 0.05, **P < 0.001, ***P < 0.0001, ****P < 0.00001 (1-way ANOVA with Tukey post hoc analyses). PFF, preformed fibril; TRMT, treatment; CTL ASO, control ASO. Statistical significance was also achieved when using nonparametric test Kruskall-Wallis for Figure 3, D and E; P ≥ 0.02. The same animal was high for TH and DA levels.

