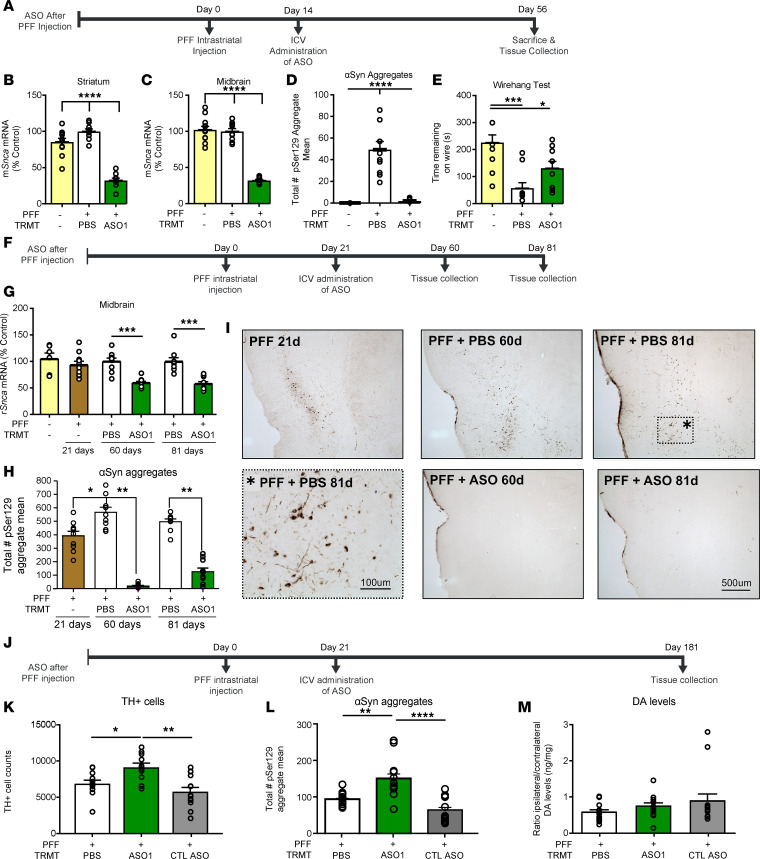
Figure 4. Pathogenic aSyn aggregate deposition is reversible, and its amelioration prevents TH loss.
(A) Timeline for ASO administration after PFF injection paradigm in the mouse. (B and C) mRNA reduction by RT-PCR (n = 12, 10, and 10 for naive, PBS, and ASO1, respectively) (D and E) Quantification of aggregate reduction in the substantia nigra by IHC (n = 4, 10, and 10 for naive, PBS, and ASO1, respectively) and performance on a wire hang task (n = 10, 10, and 10 for naive, PBS, ASO1, respectively). (F) Timeline for ASO administration (1000 μg) for G–I. (G) Quantification of Snca mRNA reduction in the midbrain at each time point. (H and I) Quantification of immunostaining for pSer129+ aggregate counts in the midbrain, and representative images from the insular cortex (n = 10, 9, 9, 9, and 10 for PFF only, PBS 60 days, ASO1 60 days, PBS 81 days, and ASO1 81 days, respectively). (J–M) Results from ASO administration (1000 μg) with study termination at 181 days. (J) Timeline for ASO administration for K–M. (K) TH+ cell counts by IHC (by stereology) (n = 12, 11, and 14 for PBS, ASO1, and CTL ASO, respectively). (L and M) Quantification of pSer129+ aggregate counts in the substantia nigra by IHC (n = 13, 12, and 12 for PBS, ASO1, and CTL ASO, respectively) and striatal dopamine levels by HPLC normalized to the contralateral side (n = 13, 12, and 14 for PBS, ASO1, and CTL ASO, respectively). Data are represented as ± SEM. *P < 0.05, **P < 0.001, ***P < 0.0001, ****P < 0.00001 (1-way ANOVA with Tukey post hoc analyses). PFF, preformed fibril; TRMT, treatment; CTL ASO, control ASO.

