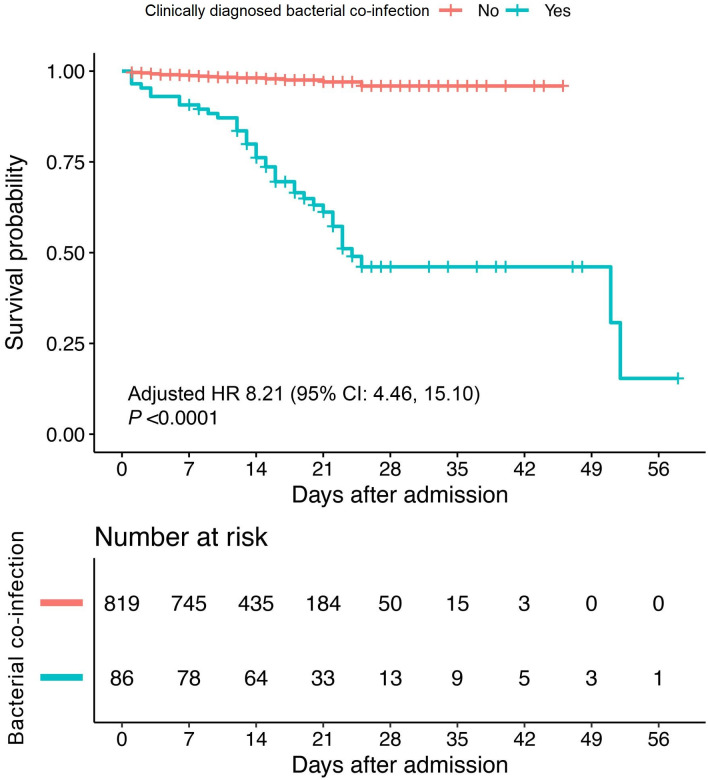
Fig 1. Kaplan-Meier curves for cumulative survival probability during hospitalization.
The red curve indicated non-CDBC patients and the blue-green curve indicated CDBC patients. The survival curves were plotted based on the day of hospital admittance (day 0). We further performed Cox regression analysis to investigate the association between CDBC and risk of in-hospital mortality with adjustment of confounding factors, including gender, age and pre-existing comorbidities. Compared with non-CDBC patients, those with CDBC were subjected to a higher risk of mortality with a hazard ratio (HR) 8.21 (95% CI: 4.46 to 15.10), that is, patients with CDBC have 721% more death risk than the non-CDBC.

