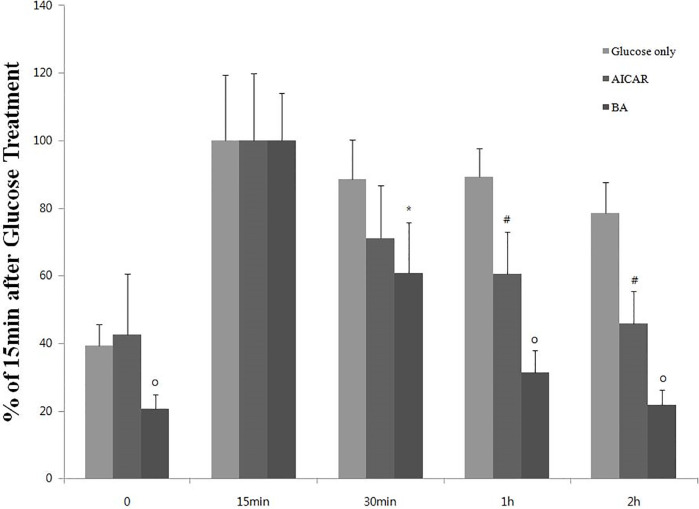
Fig 5. Effect of BA on glucose level following acute glucose challenge in ICR mice.
Results of the glucose tolerance test in ICR mice that were treated with glucose (2 g/kg), glucose (2 g/kg) + AICAR (200 mg/kg), or glucose (2 g/kg) + BA (200 mg/kg). The values represent the mean ± standard error of the mean (N = 5 for each group). ’% of 15 min after glucose treatment’ means the relative percentage amount of blood glucose when the blood glucose level measured 15 minutes after glucose injection is set to 100%. Statistical significance of differences from the control glucose-only group is indicated as follows: *P < 0.05, #P < 0.01, and oP < 0.001.

